
LCV Editorial December 2014


LCV Marketplace
Christmas is coming and the goose is getting fat - along with the LCV auction sale catalogues it would appear! With entries noticeably higher compared to the previous month the shortage of stock seemed to be easing – on paper at least! On the face it the supply crisis, that many felt was imminent, may well have been averted, however, appearances can sometimes be deceptive. The actual number of vehicles sold month on month was down by around 40% during October. This suggests that the number of unsold vehicles being re-entered for sale is masking the underlying supply issue, which is that there are relatively fewer first-time entries on sale. None of this appeared to put off the regular professional buyers though, as auction attendance levels remained healthy throughout the month. With many familiar faces turning up in unfamiliar places, it was clear that some buyers were prepared to travel further afield to acquire stock adding weight to reports that retail demand remains strong. According to our own independent inspections the average amount of damage per vehicle has actually decreased indicating that the quality of stock has improved slightly. However, the actual number of damaged vehicles appears to have increased significantly so buyers are faced with less choice when it comes to vehicle condition. In the car derived, light and medium van sectors buyers are clearly demonstrating their unwillingness to pay over the odds for damaged vehicles and this has been reflected in the guide values over the past two months and yet again in this edition. However, in the 2.8t – 3.5t panel van sector at this time buyers are faced with little choice and we have witnessed many examples of ‘Below Average’ condition vehicles selling above ‘CAP Average’ guide values.
It is worth reminding subscribers that, as well as receiving actual sales results directly from all types of vehicle remarketing routes and auction sales around the country, we attend up to half of all the open auction sales each month and, of those sales, we independently inspect the condition of around 20% of all the entries. We assign monetary values to the extent of damage exhibited on each vehicle we inspect based on a tried and tested damage estimating model. We constantly measure the impact that damage has on the prices that buyers are prepared to pay for vehicles along with mileage, specification, source and supply volumes has on market prices.
Compared to last month, auction entries were up by 18%, however, much of this improvement can be attributed to re-entries. Whilst the average age of vehicles increased slightly from 62 to 63 months. With the average mileage of entries increasing from 83,188 to 84,697, the market remains deprived of low mileage good quality stock. From our own independent inspections at auctions around the country we found that the average repair cost for body panel damage on vehicles presented for sale has decreased marginally from £360 to £327. Whilst vehicle condition appears to have improved slightly the proportion of entries exhibiting body panel damage has increased which we attribute to the increasing number of re-entries.
The market has been dogged by stock shortages all year and this is likely to continue as we head towards the Christmas Holidays. According to SMMT new registration figures there were 667,000 3 to 5 year old LCVs in operation during 2014 and this will rise to 721,000 in 2015. Assuming average vehicle replacement cycles remain the same, this means we are likely to see an 8% increase in the number of 3 to 5 year old vehicles in the used LCV wholesale market during 2015 which can only help to stabilise prices. With no real sign of any downturn in economic growth we see no reason why retail demand should falter and we are expecting another good year for the used LCV Market.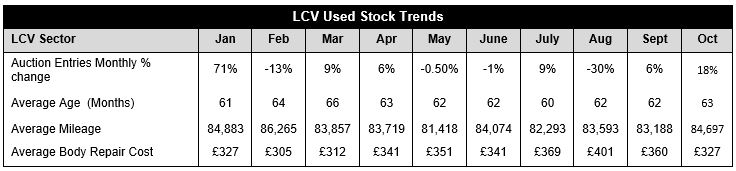
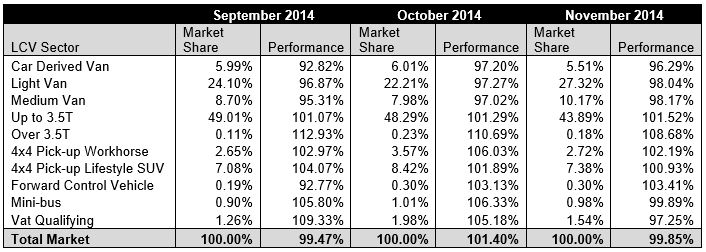
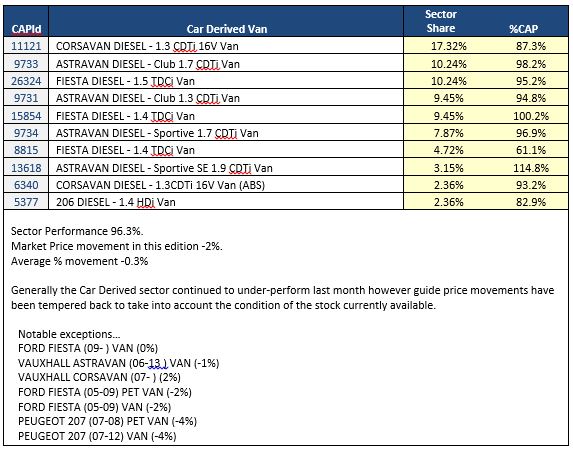
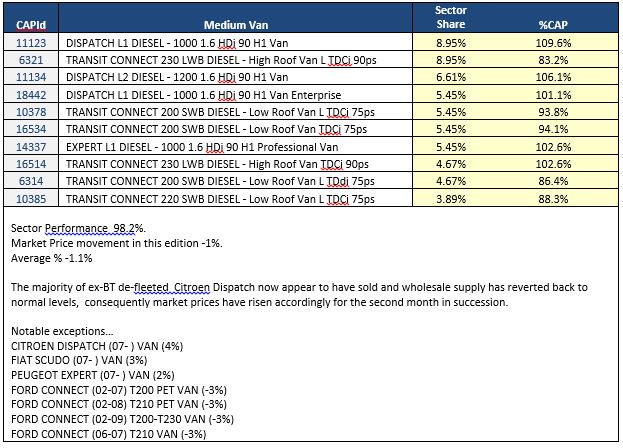
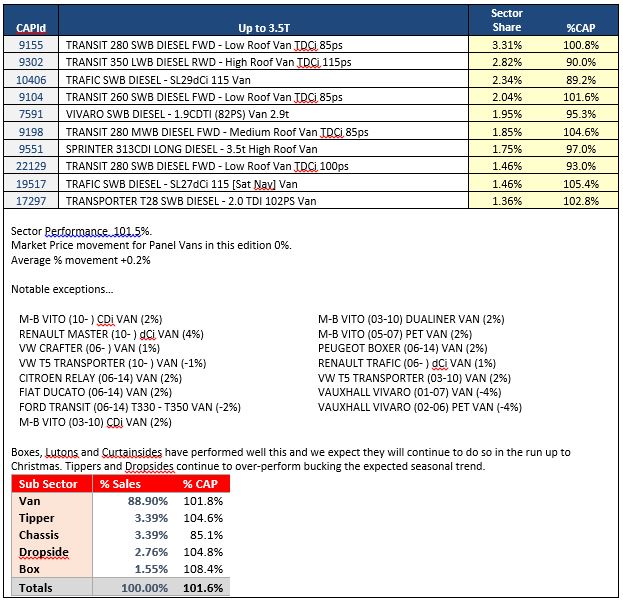
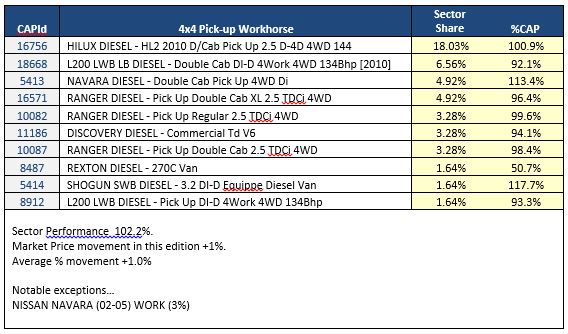
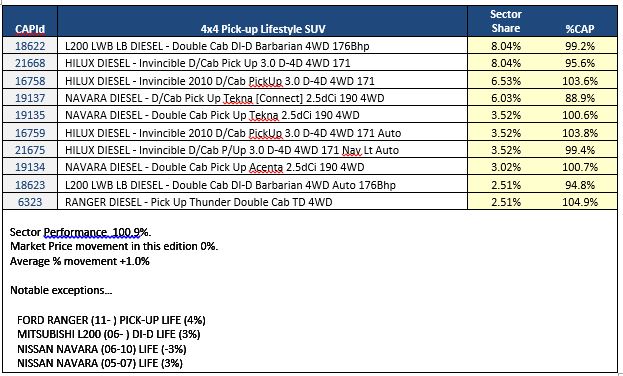
The top 10 models in the sector tables below are intended to give you a clearer view of what’s driving the market. It should be noted that that the Sector Share is based on actual sales and not the availability of these models in the marketplace. The %CAP performance values are also based on actual sales.
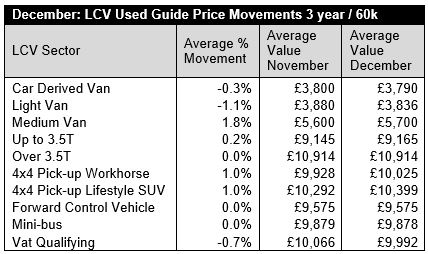
Since our guide values reflect the market prices of basic vans in plain white as they appear in the vehicle manufacturer’s price lists, some of guide price movements you might see in this edition may not correlate directly with the sales performances shown in the tables which include vehicles in all colours and specifications.
In some of these tables you may also notice the same model description appearing more than once, however, the CAP Identity numbers will always be unique. Generally the lower CAP Identity numbers signify older models and higher ones are newer models; further details can be found by looking up the model/CAP Id number in the prices section of the guide.

Ken Brown- Red Book Editor, LCVs