LCV Editorial September 2014


Considering that August is the most popular time for people to take their summer holiday break, the auctions we attended seemed reasonably busy and most lots appeared to be selling on the day. At some of the sales there were noticeably more non-trade buyers around but overall they were outnumbered by professional trade buyers of which only a few familiar faces were conspicuous by their absence. This is perhaps not surprising during a year where, so far, we haven’t really been able to detect the traditional seasonal buying pattern and the effect it has had on market prices despite what many other industry commentators appear to be saying. As reported last month, prices have generally been falling consistently since Easter and, although it’s expected they would continue to do so during August, no doubt there will many trade buyers who will welcome confirmation of this continued downward trend.
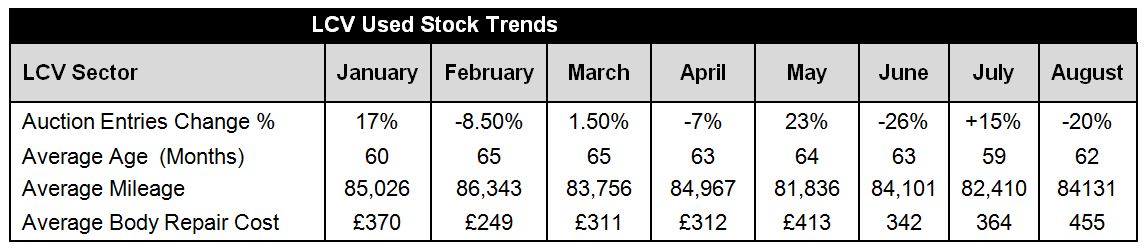
From a supply perspective auction entries were down by around 20% in August when compared to July. The average age increased slightly from 59 months to 62 months and the average recorded mileage increased from 82,410 to 84,131. The increased age and mileage was perhaps to be expected as there were noticeably more late plate vehicles around in July which clearly had a positive effect on the overall averages. It was obvious from a cursory glance when walking down the vehicle line-ups that the quality of stock presented for sale had deteriorated. Our own independent vehicle inspections confirmed this to be the case with the average repair cost for body panel damage increasing from £364 to £455. However, this may well be attributed to the lower number of entries, fuelling the widely held ‘seasonal belief’ that vendors are ‘holding back the good stuff until the holidays are over’ - as one buyer put it!
More disconcertingly though are the comments we are picking up from some dealers that retail sales have been slowing down for some time and are now completely flat. Despite the fact that prices have been falling for most of the year the belief is that they are still at an unsustainable level and by the time auction fees, delivery charges and even minimal sale preparation costs have been added along with a fair profit margin, forecourt sale prices are too high and putting off potential buyers. Judging from the auction buying activity across the country it’s difficult to ascertain if some regions are finding it harder than others and if it applies to all sectors, vehicle age and price ranges. However, the small business / one man band segment seems to be worst affected as they are still having difficulty obtaining finance. Generally they are looking for vehicles under a £4K ceiling but that doesn’t buy much these days particularly if they are looking to replace an older vehicle. Many are finding it isn’t worth the expense for only a marginal improvement in age and mileage.
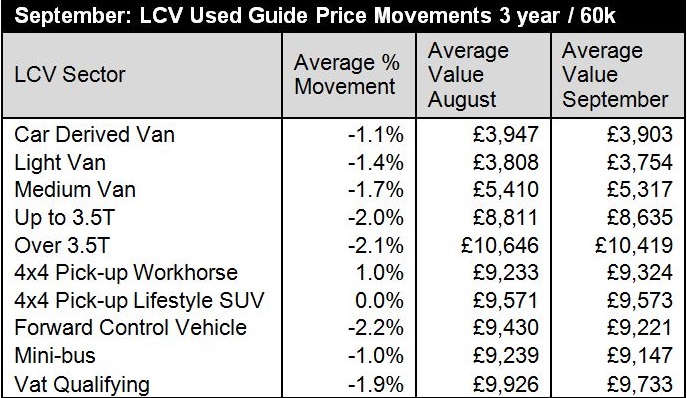
We reported some time ago in this editorial that the used LCV wholesale market is in danger of becoming a victim of its own success as market prices reached record levels. Whilst record prices makes a great headline and is certainly good news for vendors and auction houses alike, we are sure all would agree that too much over-age stock on the forecourt isn’t good for anyone involved in selling commercial vehicles – new or old. It seems inevitable that wholesale prices were going to fall again this month but it remains to be seen if they have moved down enough to have any effect on retail sales and they may have some way to go before they reach a sustainable level.
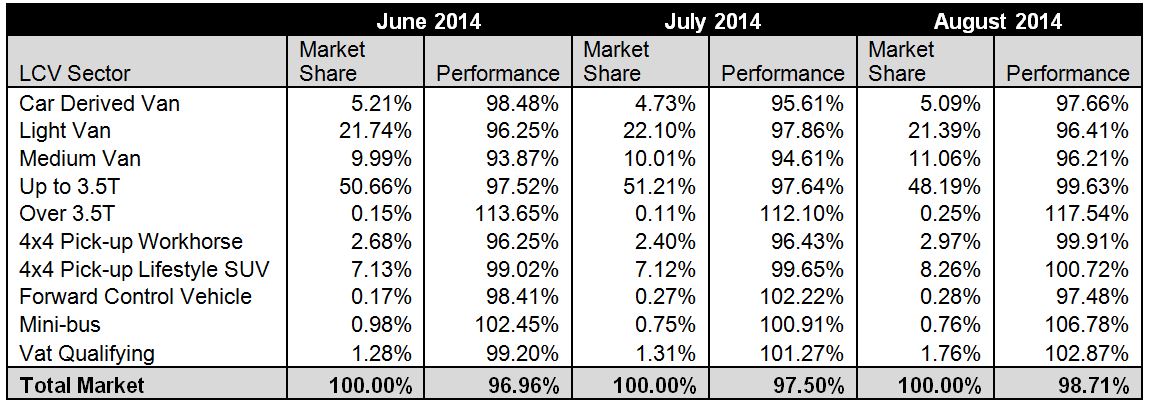
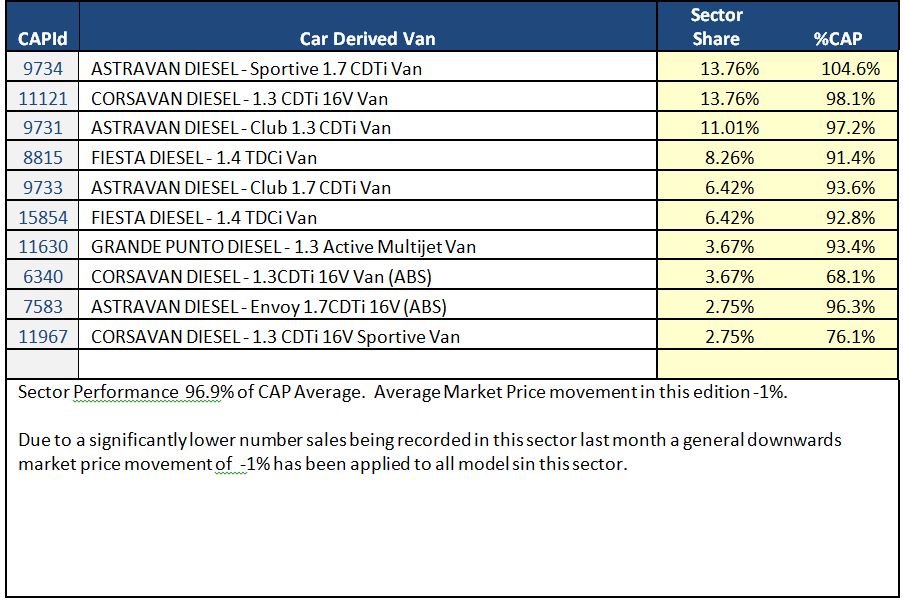
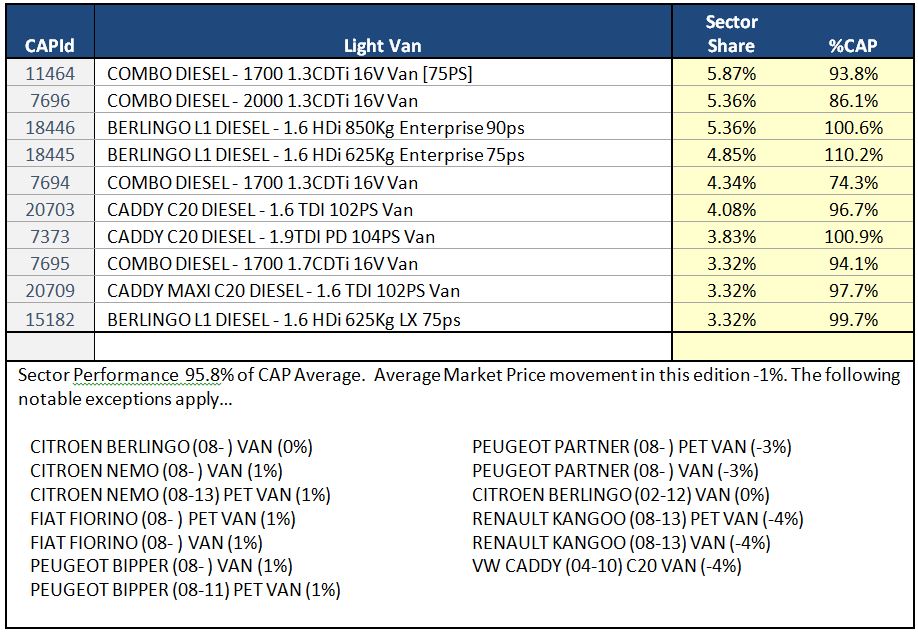
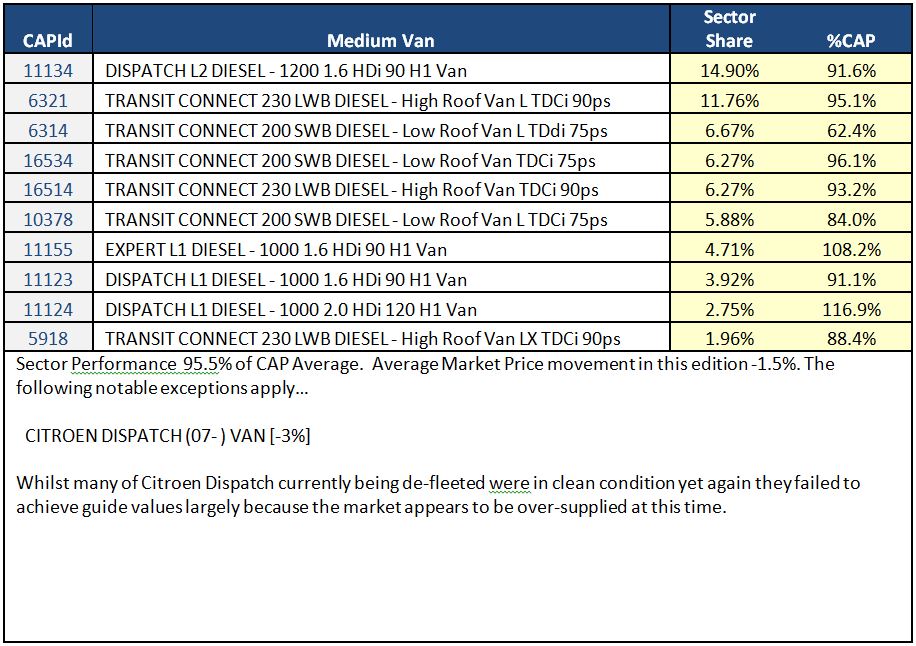
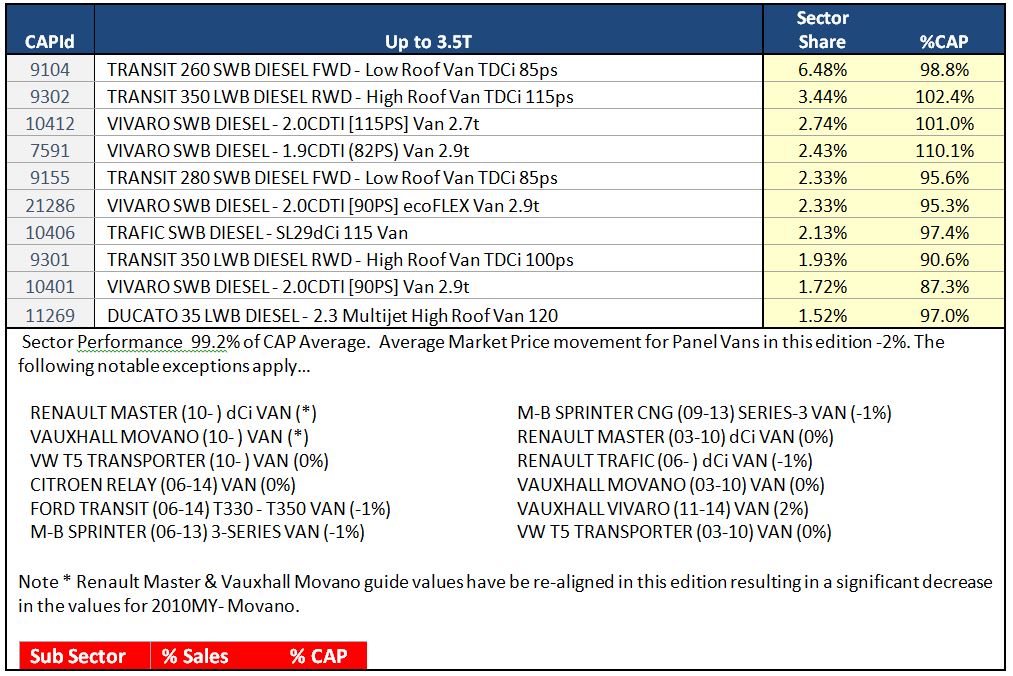
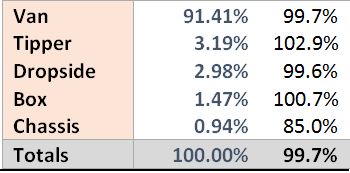
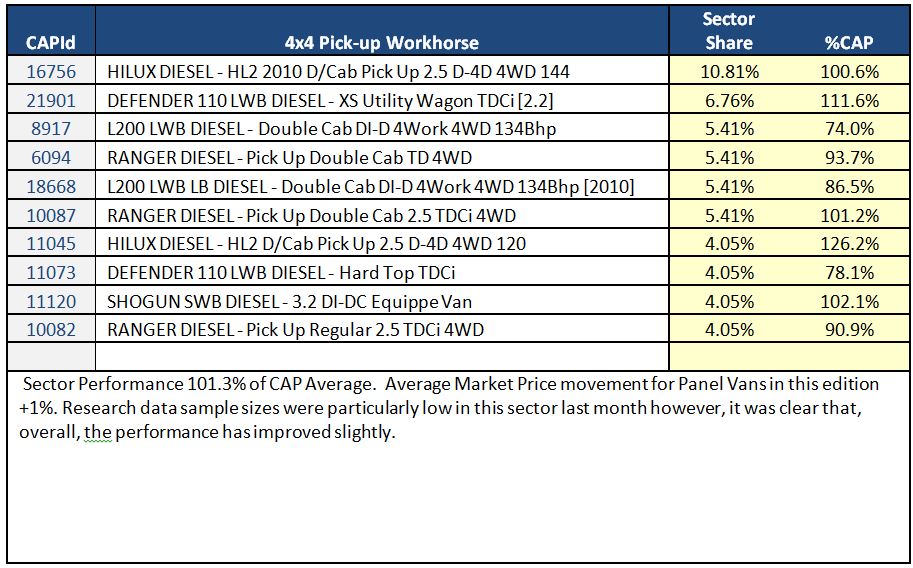
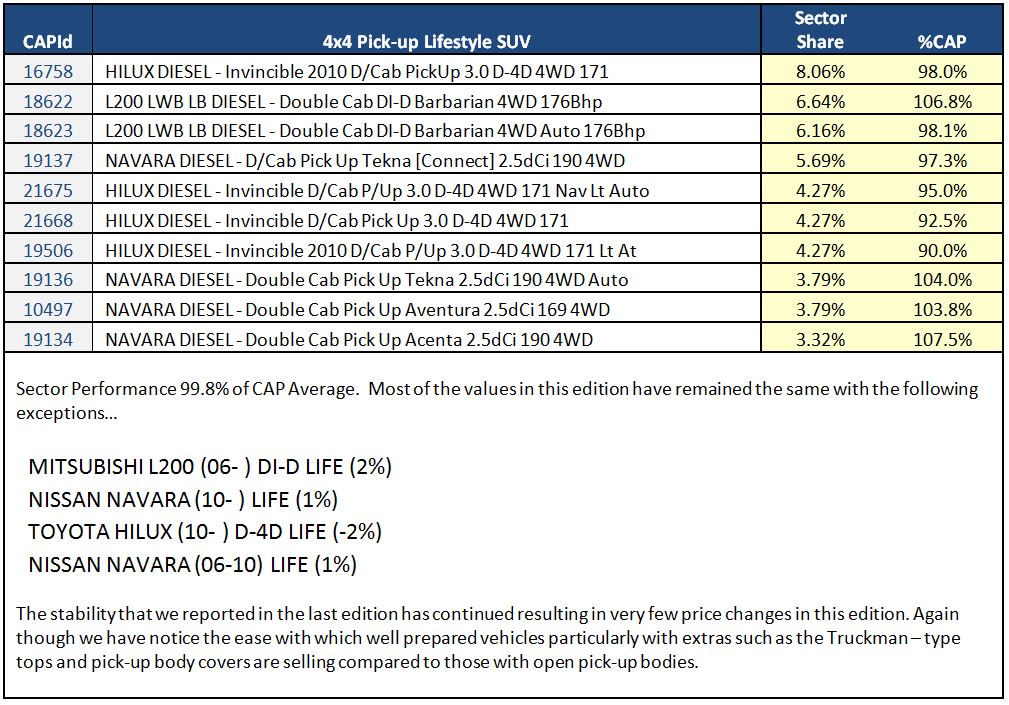
The top 10 models in the sector tables below are intended to give you a clearer view of what’s driving the market. It should be noted that that the Sector Share is based on actual sales and not the availability of these models in the marketplace. The %CAP performance values are also based on actual sales.
Since our guide values reflect the market prices of basic vans in plain white as they appear in the vehicle manufacturer’s price lists, some of guide price movements you might see in this edition may not correlate directly with the sales performances shown in the tables which include vehicles in all colours and specifications.
In some of these tables you may also notice the same model description appearing more than once, however, the CAP Identity numbers will always be unique. Generally the lower CAP Identity numbers signify older models and higher ones are newer models; further details can be found by looking up the model/CAP Id number in the prices section of the guide.