Forced Registrations and Used Values
The outlook for future used car values continues to be dominated by the situation in mainland Europe. Although there was some positive spin applied to the media reports on the European new car registration figures for April 2013, the situation remains incredibly gloomy – if the number of sales days is taken into account, the April data was actually -6% versus 2012 (as opposed to the +1.8% reported in many news feeds) and -7% year to date. And that’s including the positive impact of the buoyant UK market.
Manufacturers are in a very difficult position. With exchange rates remaining stubbornly anchored between €1.16 and €1.18, the option of directing significant excess volume to the UK is not desperately appealing, especially when allied to moderate levels of discounting. They still have several options open to them, although none are particularly appealing. They can either sell vehicles in the UK at (probably) a small loss, or build up unhealthy levels of stock, or continue to harm productivity with further cuts in production, or close plants. Forcing registrations into the UK is probably the lesser of several evils from that perspective.
So does it matter? Well, yes, certainly from a residual value perspective in the UK. We are currently in the process of improving our internal forecasting model in general and the macro-economic element in particular. From the regression analysis that has been performed to date, we can quite clearly see that used values for most vehicle sectors are negatively impacted by increasing new car registrations. The significant metric varies from sector to sector, but the simple fact is that if more new cars are forced into the UK, used vehicle values will be under downward pressure. Clearly, this is something that most residual value analysts will agree with – it makes logical sense and fits in with experience of the market over recent years – however, going forward we will be quantifying the expected impact by sector and fuel type and differentiating by age of vehicle as part of our Forecasting Development Project.
We will be concentrating on analysis of the Year Over Year % change in the used car market (YOY%). This measure of market inflation/deflation (+%/-%) is calculated by looking at how values at the same age and mileage have changed compared to where they were exactly a year ago. If you look at how values have evolved over the past 12 months, you can clearly see that values of 1 year old cars have been negatively impacted by the volumes of registrations which have been forced into the UK by manufacturers.
Total Market - YOY% Market Deflation By Age @20,000 Miles Per Annum

At a time when most observers have considered the used car market to have been benign at worst and in some cases been described as “booming”, it may surprise some to realise that 1 Year Old prices have been below where they had been 12 months previously for most of the last year (currently -1.5% vs. May 2012 overall), the only exception being caused by the unexpected lift we saw in values in October 2012.
Conversely, older vehicles have been benefitting from this situation and have been rising for most of the past year, mainly due to shortages of stock. Going forward, we would expect to see some reductions in 4 & 5 year old values from their current dizzy heights, particularly as we are starting to see some anomalous results between model generations. Care must also be taken when reading this graph – 5 year old values are not (yet) falling – reducing values above the zero line indicate a reduction of the rate at which prices are increasing.
If however, we look at a sector which is impacted far less by forced registrations, such as Large Executive for example, then we see a different picture.
Large Executive - YOY% Market Deflation By Age @20,000 Miles Per Annum

Values of 3 & 4 year old cars are lower than they were 12 months ago, but 1 year old cars have now slightly increased in value. The recovery in 1 year old values from a level of -13% deflation in May 2012 is in line with the retail led increase in new car registrations, however we would not expect prices to increase much further due to the current pressures on dealer margins.
Going forward, we will have much more to share in terms of the learnings from our analysis connected to the new forecasting model development and we will continue to share it with you. When our new, fully transparent forecasting product is available later this year, you will be able to see all of the assumptions and market intelligence behind our forecasts for yourselves, but we intend to continue to add value by providing interpretation and analysis of the data and what it is likely to mean for future values.
Regression Modelling Of The Market
We are making fantastic progress with our attempts to model the historic used car market and bring more statistical rigour to our internal forecasting process. Differentiating by vehicle sector, fuel type and age of vehicle, we are generating formulas to explain what has happened in the past and then will be applying forecasts to the significant variables to provide an overview of how we expect the market to move in the future.
If we take a typical fleet sector such as Upper Medium Diesel at 36/60 as an example, we are now able to explain over 85% of the historical variation in used car prices with just 5 variables covering aspects of GDP growth, exchange rate movements and vehicle registrations. If our market assumptions had been based around this model over the last 10 years, we would only have been outside of a +/- 5% tolerance for 18 of the past 120 months. Interestingly, the period when prices fell in 2008 is explained with hindsight by the model, but there is a 9 month period when values recovered faster than expected in 2009/10. If this period is removed, we would have been within the desired tolerance 92% of the time over the course of almost 10 years.
Upper Medium Diesel 36/60 - Actual YOY% vs. Regression Modelling
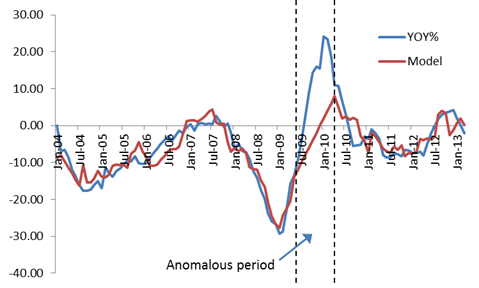
The next stage of the project is to complete this for every sector/fuel/age combination and then to develop market forecasts. To do this we need to study the historical accuracy of externally available forecasts to determine what the best source is and also whether there is any cyclical nature to the accuracy of the forecasts for metrics such as GDP. Once these can be incorporated into the calculation, we will be able to publicise our new market forecast assumptions in detail and provide some real insight into not just our own forecasting process, but also into the intricate workings of the real used car market.

Dylan Setterfield - Senior Editor - Forecasting