The following steps describe the forecasting process used to create a Gold Book forecast.
Step 1 – Identification of Master Vehicle
Detailed analysis is based on a single vehicle to represent the model range. This is usually the derivative which CAP believes will likely see the most volume in the market, as this will generate more Black Book data for use in reforecasting. On some occasions we may select a different benchmark vehicle to aid with competitor comparisons within the vehicle sector. Forecasts for other vehicles within the range will be set via the Walk-Up process (see later).
Step 2 – Identify Current Black Book Values
Our first aim is to generate current Black Book values for the benchmark points (12/20, 24/40, 36/60, 48/80 and 60/100). Where these are already available in current Black Book they will be incorporated automatically. Otherwise, we will need to identify a string of ‘donor vehicles’ which will enable us to calculate a Black Book value at the benchmark points. This could require one or more donor vehicles. Donor vehicles are always selected as the most closely related to the master vehicle being forecast, however, in some examples it may be necessary to choose a different range, possibly even from a different manufacturer.
To create a Black Book value for a current vehicle where it does not already exist in Black Book, we apply a proportional difference (usually an uplift) to the value for the donor vehicle to provide an expected value for the current vehicle (what it would be worth if it was available today at the selected age/mileage). So if a current master vehicle was worth +8% more than the donor vehicle at 12/20, but was not available at 24/40, we would increase the 24/40 value for the donor vehicle by +8% to get the expected 24/40 value for the current vehicle. A similar process is followed for all 5 benchmark points as necessary.
Proportional (%) differences between successive generations are generally consistent at 1-3 years. As the vehicle increases in age and decreases in value, the £ difference between successive generations continues to decrease, but at a slower rate than the vehicle itself. Therefore the proportional (%) difference typically increases at 4 and 5 years, and this is accounted for via the Black Book proportion adjustment applied to the master vehicle derived values.
Step 3 – Applying Deflation (YOY%) Forecasts
Our expectation of future market movements are expressed in terms of Year Over Year % Deflation/Inflation (YOY%). This is derived from tracking changes to the same age/mileage value for the same vehicles over time and is a ‘pure’ market measure, unaffected by the impact of model replacement (which is taken account of in the starting Black Book value as above).
The overall market is segmented by age, vehicle sector and fuel type and separate YOY% estimates are provided for each age/sector/fuel combination.
Since this involves tracking the same models over time, it also incorporates an element of model aging and as a result this will often be a negative (deflationary) adjustment. At a later stage we also capture an additional (+/-) amount related to the age of the individual model, calculated by sector & fuel type from historical data (see Step 4– Applying Model Life Overlay).
YOY% deflation forecasts are calculated through regression analysis, which is carried out using a wide range of macro-economic supply and demand factors to identify those that are significant in predicting value movements. Each deflation profile is identified according to the vehicle age, sector and fuel type and gives the market-only movement predicted for this group of vehicles.
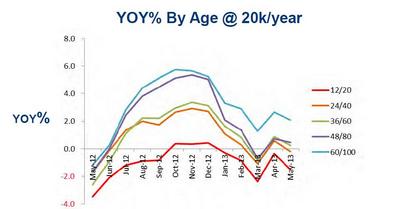
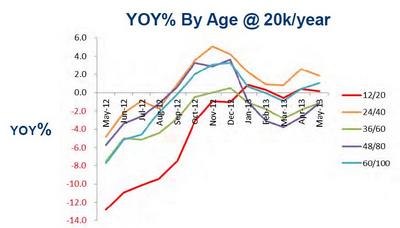
By breaking the forecasts down into this level of granularity, we can ensure a more accurate and specific deflation forecast. For example, the following graphs show how a specific sector and fuel type can differ in terms of overall market deflation:
Total Market by Age
Large Executive by Age
Deflation adjustments are applied at the 12/20, 24/40, 36/60, 48/80 and 60/100 age/mileage points and consist of a percentage adjustment to the values obtained at the end of step 2. In Gold Book iQ these assumptions are exposed for each individual year in the future.
More information on Year on Year Deflation
Step 4 – Applying Model Life Overlay
The next adjustment to apply is to the model life overlay which consists of 3 distinct metrics which combine to create the total model life, which contains adjustments for up to 7 years of model life, with the 7 year values being used for any model over this age.
The first metric is an adjustment for the vehicle age. This profile is applied according to the vehicle sector and fuel type and accounts for the additional inflation/deflation expected for the target vehicle when compared to the sector average. Two further factors, Future Trends and Fuel Efficiency are specific to the master vehicle being forecast. Future trends allow us to make adjustments where the Editor believes that this vehicle will behave differently to other vehicles in the same sector for reasons outside of vehicle age or fuel efficiency. A full explanation of the reasons behind these adjustments will be included in the Model Life commentary which accompanies the forecast.
Step 5 – RV Analysis
Editors perform analysis of the forecast values to ensure the petrol/diesel relationship is correct, as well as checking the current versus previous generation RV relationship is right. A group of competitor peer vehicles are also analysed, ensuring the RV position against these derivatives is as expected.
Step 6– Editorial Adjustments
After the initial forecast has been reviewed and analysed against relevant peer vehicles.
The Editor may choose to adjust the forecast in relation to those peer vehicles in one of 3 ways:
- At 36/60 with the adjustment proportionally applied to other benchmarks
- At 36/60 with the adjustment proportionally applied to other benchmarks and over-ridden with a custom adjustment at 12/20
- At 12/20 only with no effect on other benchmarks
The editorial adjustment, if made, is the last adjustment required to create a forecast for the master vehicle and where this is applied it will be accompanied by commentary in Gold Book iQ.
Step 7 – Complete the Range Walk-Up
Remaining derivatives within the range are forecast by using ‘tagging’ functionality to set subsidiary relationships between the master vehicle and other derivatives. As mentioned in Step 1, the Master Vehicle is chosen as the most representative derivative and so ‘walk-up’ adjustments may actually be in either direction.
Tags are broken down into the following categories:
- Trim – eg. Setting the relationship between an ‘S’ and an ‘SE’
- Engine – eg. Setting the relationship between an 1.4 and a 1.8 engine
- Body Style – eg. Setting the relationship between a 3 door and a 5 door
- Transmission – eg. Setting the relationship between a manual and an automatic
- Features – eg. Setting the value for individual features such as 4 wheel drive
All values are set by the Editor at 36/60 and proportionally adjusted to the other benchmarks.
Research into the correct relationship between tags is completed using specification comparisons, engine comparisons, and by performing Black Book trend analysis.
Step 8 –Calculating Intermediate Months
The remaining months between 12/24/36/48/60 are calculated using expected seasonal depreciation patterns specific to the vehicle sector and fuel type.
Step 9 – Applying the Mileage Curve
A mileage curve is a % adjustment which reduces the value of the vehicle by a variable percentage amount for every 10,000 miles up to 200,000 miles. Adjustments are managed separately for the vehicle ages from 1 to 5 years allowing different mileage relationships for different vehicle ages.
Many mileage curves are researched by individual model range and fuel type and are applied accordingly.
Step 10 – Progression of the forecast
CAP Gold Book forecasts move from month to month according to expected monthly seasonal movements which include uplifts in January, March and September according to the expected premiums for changing registration plates. However, the underlying CAP forecast remains unchanged until the vehicle is reforecast and as a result brand new models will not begin to depreciate until their initial forecasted values are changed.
In Gold Book iQ, customers will have the facility to remove the monthly seasonality and view the (unchanging) normalised seasonal position. It will also be possible to ‘lag’ a forecast, thus enabling values from a future registration start date.