Traditionally, CAP (and all of our competitors) have generated future vehicle forecasts based on simple depreciation curves. The main reason for this is that depreciation curves are the simplest way to database and systemise a forecasting system. Unfortunately, they do not reflect the reality of the used car market. With Gold Book, we are still, in effect, generating depreciation curves, but they will not resemble the traditional, smooth curves of the past (the red line in the depreciation graph). Instead, they will display a more realistic, jagged line, which will be much more representative of real used car price movements in both the long and short term (similar to the blue line on the graph).
Typical depreciation curve:

Gold Book forecasts are based on taking today’s Black Book used value and then applying our expectation for future market movements, sector and vehicle specific model life factors and finally adjustment by the Gold Book Editorial Team. Our expectation of future market movements are always expressed in terms of Year Over Year % Deflation/Inflation (YOY%), which is a ‘pure’ market measure, unaffected by the impact of model replacement (which is taken account of in the starting Black Book value).
We are aware that some people in the industry tend to compare overall average used values (or disposal proceeds) from month to month. Unfortunately, this can be misleading at best. Often data is published which does not strip out the effects of age, mileage, condition or model mix, all of which can severely distort the data. The basket of vehicles constantly changes over time, with a whole host of facelifts, new generations and brand new models being introduced every month to replace existing vehicles. The impact of new models IS very important and that is why Gold Book highlights it explicitly in the calculation of the starting Black Book value at the very first stage of the forecast process. For anyone setting residual values, the absolute value (or future estimates) of average 3 year old prices for a constantly changing basket of vehicles has little or no relevance. In a flat market, a new model replacing the previous one at any particular age can give a false impression that the market has improved, whereas all that has changed is the model mix.
Many, especially manufacturers, also continue to report in terms of a returned % of original list price, even though most in the industry recognise that this is an entirely artificial construction and has little or no relevance for analysis of used values. After all, nobody looks at a 3 year old car at an auction and refers back to what it cost when new. Two vehicles on the same registration plate could quite easily have had different list prices when new, but will be regarded as equivalent when used. The only general rule for used values with regard to list prices is that a used car should always be valued less than a brand new one!
We segment the overall market by age, vehicle sector and fuel type, with separate YOY% estimates provided for each age/sector/fuel combination. This metric is based on a weighted index of registrations for each plate and always calculates like for like monthly movements for the same derivative at the same age and mileage.
Since this involves tracking the same vehicles over time, it also incorporates an element of model aging and as a result this will often tend to be a negative (deflationary) adjustment. At a later stage we also capture an additional (+/-) amount related to the age of the individual model, calculated by sector & fuel type from historical data (Model Life Overlay, or how the individual vehicle is expected to perform relative to the sector/fuel for which we have calculated the YOY% deflation forecast).
The model aging element of our Model Life Overlay can be seen as complementary to, but distinct from, the YOY% deflation adjustment. We are forecasting YOY% deflation for an entire sector, but some level of variation is expected within each sector – some models will perform better than average and some will perform worse. The age of the model is one of the factors that contributes towards this, the general rule being that younger models will perform better than those being replaced (although there are exceptions).
Typical YOY% tracking (Upper Medium Diesel 36/60):
It is clearly much easier to detect what has happened in terms of true used market price movements when looking at YOY% deflation – the ‘V’ shape denotes the spiralling down of prices in 2008 and strong recovery in 2009 – this same period in the depreciation curve is the first small ‘kink’ in the line.
How to calculate YOY% deflation today for an individual vehicle
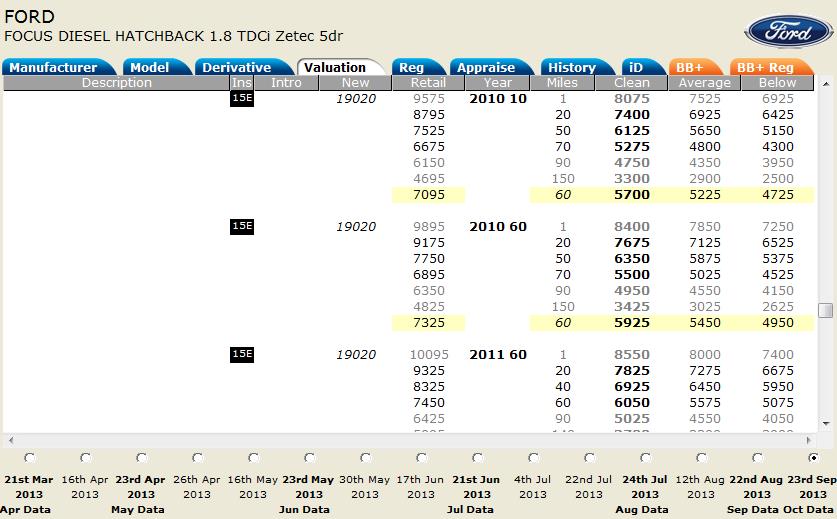
Let’s take a Diesel Ford Focus (Lower Medium sector) at 36/60. We start by taking the 36/60 value today:
CAP ID 38959 Ford Focus 1.8 TDCi Zetec 5dr H/B
Oct-13 1060 @ 60,000 CAP Clean £5,925
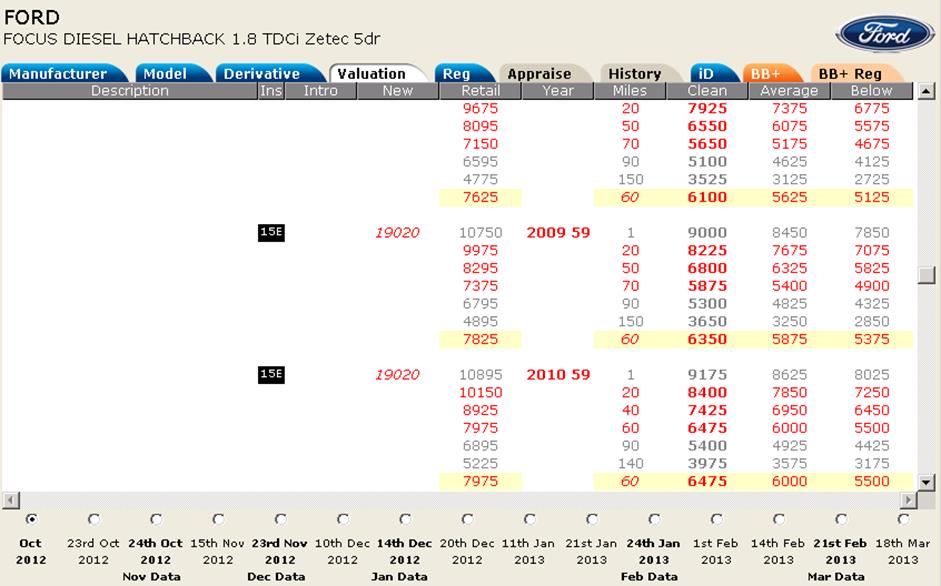
And compare to the 36/60 value from a year ago:
Oct-12 0959 @ 60,000 CAP Clean £6,350
Our Year Over Year Deflation (YOY%) is given by the following:
YOY% = (Value today – Value 1 year ago) / Value 1 year ago
= (£5,925 - £6,350) / £6,350
= -6.7%
To build up our YOY% index by age/sector/fuel, we weight the values by total sales for each id in the individual month of registration. So if we are calculating the October 2013 YOY% at 36/60, we will weight the values according to registrations in October 2010. If we were calculating the October 2013 index at 12/20 we would weight by the registrations from October 2012.
Once these indices have been calculated, we can run our regression models to determine how we think used values will change in the future, according to the expected levels of the significant input variables. This then forms the basis of our detailed deflation detailed forecast to be used in our Gold Book analysis.
By studying the year over year movement in used values and segmenting the marketplace, we are able to predict real movements in the future used car market, in a way that can be understood by all, without the confusion of new model introductions and removing the variation in sales proceeds caused by age, mileage and model mix.