
Black Book Editorial May 2014


As has been widely reported in both the motoring press and national media, March 2014 was hugely successful with regards to new car activity. According to the SMMT, the month saw 464,824 registrations, an increase of 70,018 (17.7%) over March 2013. This was the highest number of monthly registrations for a decade and the second highest since the switch to twice-yearly plate changes in 1999. Registrations for the first quarter of the year were up 13.7% on last year (688,122 versus 605,198) and that is off the back of registrations this time last year being over 7% up on the same quarter in 2012.
Private registrations continue to increase proportionally more than Fleet and Business, with the year-on-year increase for the month of March being 20.8% for the former and 14.5% for the latter; 53.1% of all cars were registered as “Private”. The availability of attractive finance deals and deposit contributions, as well as the economic upturn in the UK, continue to encourage consumers into buying a new car. Figures certainly show that increasingly consumers are switching from used to new cars when they make a purchase, as the overall deal can be more attractive.
Rental registrations make interesting reading, not least when analysing those manufacturers that posted large increases compared to March ‘13 and were also particularly active in the last few days of the month. Month-end focus in Rental, along with pre-registration activity, points towards a continued focus on hitting share in an ever growing market, as opposed to relying on natural or even price-stimulated demand. This type of increase in volume can pose a risk to used values, as these cars tend to be “short-cycle”, meaning they appear in the used market within a few months. If supply exceeds demand for these manufacturers, prices will be affected and this downward trend is likely to ripple down to cars at the 3-year point. It is important to note that not all manufacturers increased registrations in this segment (in particular Kia and Peugeot remained conservative), but those that did were not just the mainstream players – the more premium manufacturers were also active.
Used Cars - Trade Prices
April 2014 has followed a familiar pattern, with a steady downturn in demand and subsequent used car values. This tends to happen every year around the Easter period – supply levels continue to increase, due to part-exchanges and fleet returns from March’s new car activity, and demand falls as consumers focus on enjoying the holiday period. In particular, many large franchised dealers have full used car forecourts so buying for stock is not a necessity. Independents who do not have the luxury of part-exchanges generated by the new plate are still actively buying; consequently they have faced less competition and can purchase a like-for-like car for less than they would have done a few weeks ago.
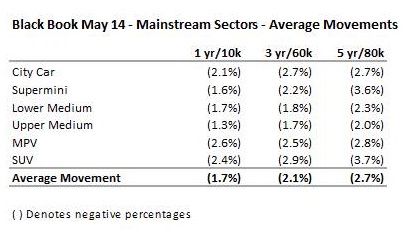
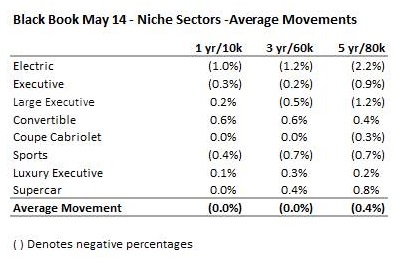
Black Book Live has generally been moving values down through the back end of March and all of April. This is the first time since October of last year that there has been this kind of pressure on prices. No volume sector remains unaffected – from City Car to MPV the movement has been a downward one. Convertibles have been particularly interesting – with price increases early on, then stability, followed by some downward pressure later in the month, certainly on those ranges with higher volumes in the market.
SUV prices have come under considerable pressure over the past few weeks. Vendors waited for a cold snap that did not materialise, and as a result, demand and prices never really peaked as one may have expected. Volumes in the market have therefore been high as realisation hits that sales prospects are only likely to deteriorate further in the short to medium-term. Given that many dealers are not keen to purchase SUVs for stock, values have been affected by more than the other sectors.
Particular areas of weakness in price can also be seen on older cars – those that are 5-years or older have had values reduced more in percentage terms than younger equivalents, due to a lack of desirability and greater supply.
It is important to note at this point that monthly published figures in Black Book do not contain any forecasting element – they are a snapshot of Black Book Live towards the end of the month. For the very latest values it is key to view “Live” figures rather than the monthly ones, as the latter can very quickly become out of date. This is particularly so in a rising or falling market and with the market certainly heading downwards at the time of writing, up-to-date figures are imperative for buyers and sellers alike. Those buyers who have Black Book Live certainly had an advantage in April over those that continued to use monthly figures, as values continued to fall.
Auction Activity
Reports from very early in April showed that auction halls were full of cars but not full of buyers. Conversion rates have been steadily falling, and in April, unlike in recent months, they were lower than for the same month in 2013. These percentages slipped throughout the month, and by the last week of April, were at around 60-65% - 6 weeks previously they had been close to 80%. Large numbers of Fleet vendors, particularly those not interested in moving reserves downwards with the market, have reported conversion rates as low as 40%. Many continue to use CAP Clean as a benchmark for cars that are more “average” or even “below” when taking condition into account.
The main reasons for these lower conversion rates are again due to increased supply and decreases in demand. With more choice comes the potential for buyers to await the next car to come through the hall rather than having to pay “top-dollar” as they may have done previously.
As always, high mileage, poor condition cars were the first and worst affected. Buyers have more choice due to increased supply and less competition, and it is these less desirable offerings that attract lower bids and tended to get left for a future sale. This can be seen in the fact that cars of 5-years old, or over, have moved down the most in percentage terms, as mentioned previously.
Used Cars – Retail
As expected, consumer demand has been dropping. This is unlikely to be a long-term trend however and is just the normal seasonal occurrence that happens year after year.
When comparing retail footfall figures year-on-year, March was up 15% in 2014, however when we entered the Easter period, the Thursday prior was up just 3% and footfall on Easter Monday was down 1% compared to Easter Monday 2013. These Easter figures are similar to last year, pointing towards recent downwards trends being little more than normal seasonality. If anything, during the first 3 months of the year performance for retail used cars was above the norm and we have now slipped into a more familiar pattern.
What Next?
In the short-term, trade volumes will continue to be high. However, the realignment of trade prices may act as a stimulus to buyers who have turned their stock reasonably quickly.
It is worth noting that the numbers of cars sitting on dealer forecourts is higher than at any time since the week before Christmas. This is quite a telling point given that it is likely that the peak selling season has now past. Until some of this stock finds retail customers, any improvement in trade buying activity will not be forthcoming.
On a more positive note for medium term prospects, there are fewer used cars in the market than there were prior to the recession – over the last 5 calendar years (2009-13) there were 1.6m fewer cars registered than in the previous 5-years (2004-8) so any pressure on values over and above the seasonal norm is unlikely long term, as supply and demand remain closely aligned.
The test will come over the next couple of months, with Bank Holidays quickly followed by a World Cup. Demand does tend to drop away over these periods with the general public’s focus elsewhere. It will also be interesting to see how used car values fare from those manufacturers’ who have actively increased their Rental share and chased market share by pre-registering cars in March.
Overall, CAP are predicting normal seasonal downward movements over the next 3 months, in the region of -1.5% to -2% per month. SUVs are likely to remain under increased pressure whilst convertibles may escape depreciation to these levels until later in the summer, after which they will no doubt fall even sharper.
As in April, when it really came to the fore once more, Black Book Live will report values real-time, throughout the month as soon as movements in prices are detected.
Derren Martin, Senior Black Book Editor
Email: derren.martin@cap.co.uk
CAP Support: 0113 222 2007