LCV Editorial April 2015


With auction catalogues noticeably much thicker than we’ve seen for some time, not surprisingly, the high auction attendance levels we witnessed during January and February continued throughout March. In fact the stock levels are currently at an all-time high according to the catalogue entries which we monitor each day. However, as always appearances can be deceptive. Although on the face of it there was plenty of bidding activity at all of the sales we attended, it was clear that not everything was selling on the day. Whilst auction entries have increased significantly so too have the number of re-entries and these need to be taken into account when considering the total number of auction entries on the day. The most probable causes of this, which was clearly evident when watching the sales, are professional buyers being far more discerning over condition, and, as our research evidence suggests, no longer being prepared to pay the sort of prices we had witnessed in previous months, particularly for damaged vehicles. Consequently this is putting a downward pressure on market prices whilst at the same time increasing unsold wholesale stock levels. This was a far cry from what we were seeing in November and December when damage was seemingly being ignored and virtually everything was selling above book on the day. It would appear that unsold retail stock is the underlying cause but this is more likely to be the result of over-ambitious stocking during the first couple of months of the year rather than falling retail demand, particularly as nothing has really changed in the UK economy and growth forecasts remain optimistic. Unfortunately this is a double-edged sword because as wholesale market prices continue to fall it is inevitable that it will have a negative impact on the value of unsold retail stock and dealer sales margin aspirations. Overall the supply situation appears to be reasonably healthy with February auction entries up by 12% compared to January. The average age of vehicles remained the same at 65 months, whilst average mileage decreased to 82,773. From our own independent vehicle inspections on average the overall quality of auction entries has improved with the average repair cost for body panel damage on vehicles presented for sale decreased from £314 to £287.
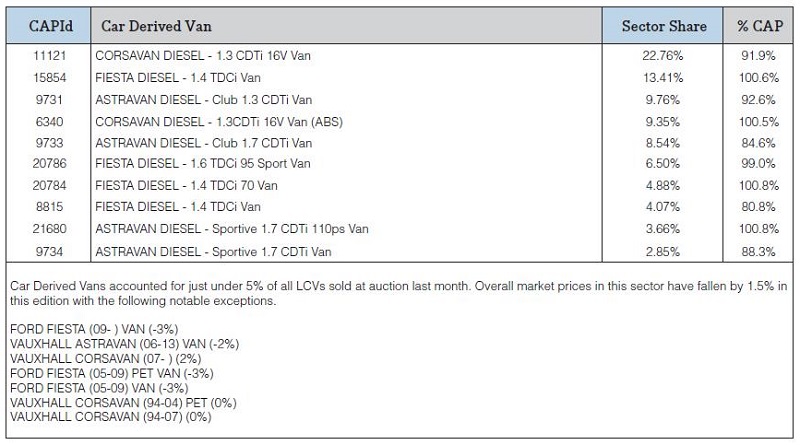
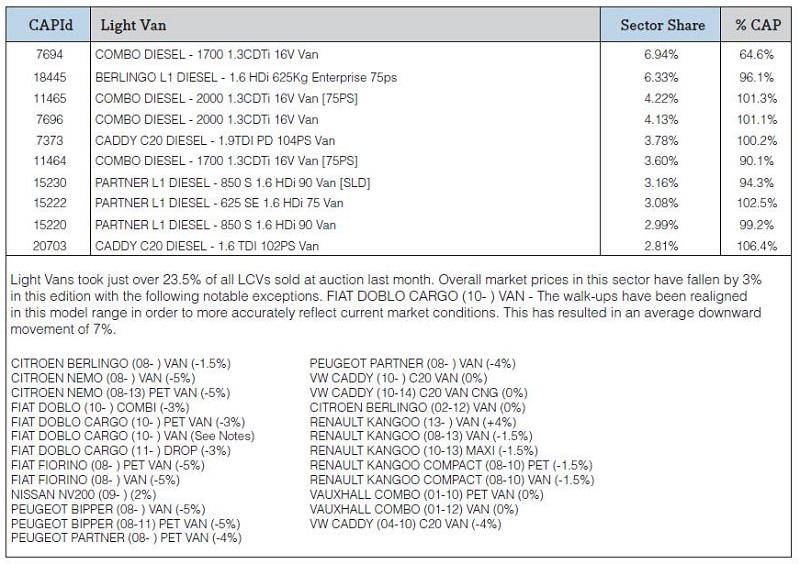
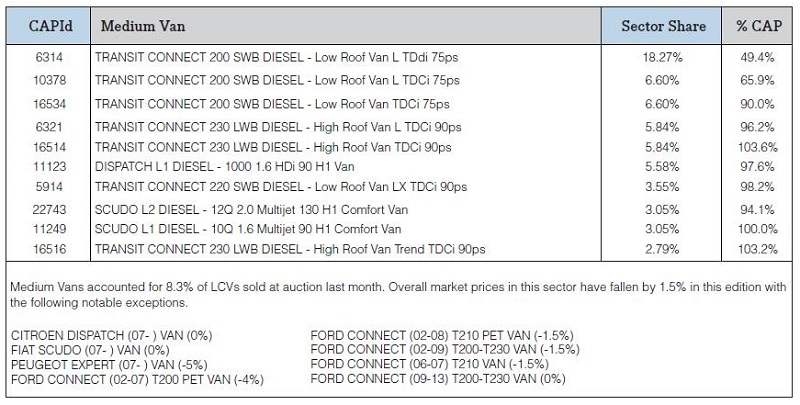
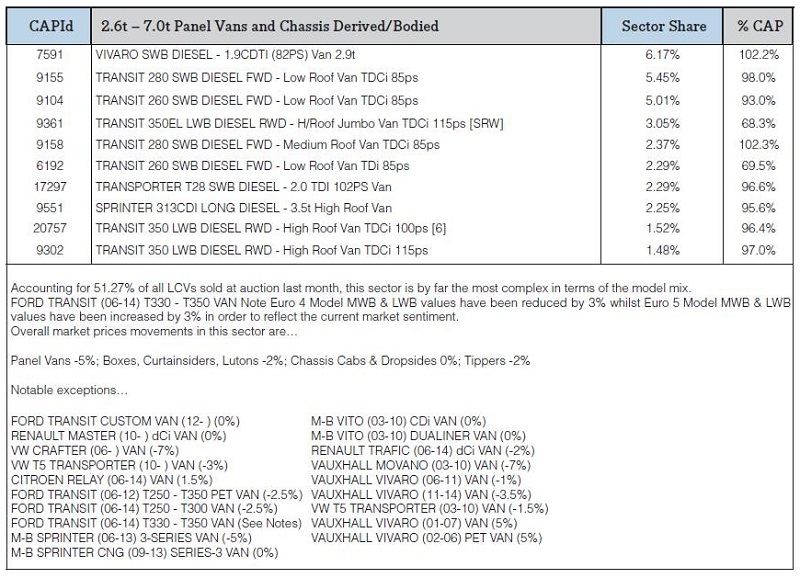
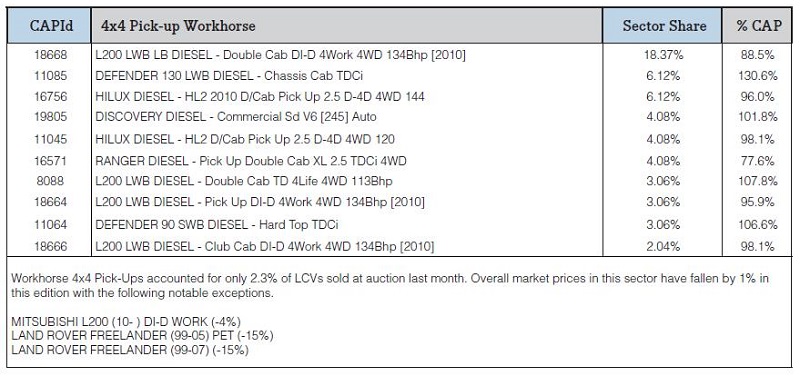
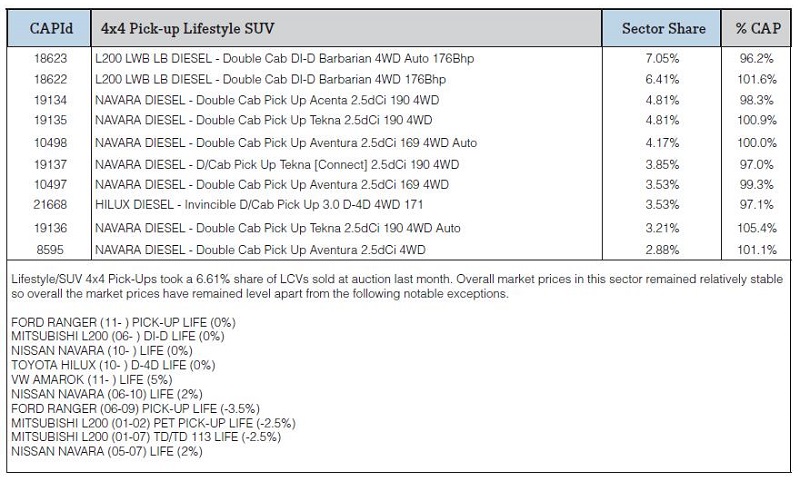
The Top 10 Models in each sector tables below are intended to give you a clearer picture of the models that are driving the prices in the used LCV Market. It should be noted that that the Sector Share is based on actual sales and not the availability of these models in the marketplace. The %CAP performance values are also based on actual sales.
Since our guide values reflect the market prices of basic vans in plain white as they appear in the vehicle manufacturer’s price lists, some of guide price movements you might see in this edition may not correlate directly with the sales performances shown in the tables which include vehicles in all colours and specifications.
In some of these tables you may also notice the same model description appearing more than once, however, the CAP Identity numbers will always be unique. Generally the lower CAP Identity numbers signify older models and higher ones are newer models; further details can be found by looking up the model/CAP Id number in the prices section of the guide.