
LCV Editorial March 2015


Most of the sales we attended last month seemed busy enough with a healthy mix of professional trade buyers in attendance, however appearances can be deceptive because closer analysis of our research data revealed that sales conversion rates were lower and average market prices had slipped considerably compared to the previous month. There was a distinct change in mood evident in the halls with bidding noticeably weaker than we have seen of late. Whilst stock levels remained high throughout the month overall, there was clearly a change in the model mix. As expected, the ex-City Link Transits were selling well below the guide price of the equivalent basic white models. Much of this can be attributed to the less than desirable colour and generally poor condition, but nonetheless they were selling and clearly representing good value for money. With so many of them in the market at this time retail buyers are likely to be spoilt for choice so it’s good to see that sensible reserve prices were being set. As mentioned in the last edition, sales of ex-City Link vehicles do not directly influence the guide values as we benchmark plain white vehicles in the basic spec as they appear in the vehicle manufacturer’s price list. It’s worth noting that, at the time of writing, the total sales values of ex-City link vehicles amounted to almost £600K. This is a significant proportion of the total spend on trade sales and, since this large de-fleet literally came out of the blue, we are keeping a close eye on the impact it could have on sales of other used LCVs. Ex-daily rental duplicate stock entries in particular were plentiful and ‘hard work’ to sell at times according to some auctioneers we spoke to. Renault Trafic and SWB Transit, normally the bread and butter of the used LCV retail market, have fallen out of favour and were struggling to get bids at times. These models would have sold with ease only a few weeks ago irrespective of their condition. In January, Transit SWB 280 was performing, on average, at just over 99% of the guide price, but last month the average performance slipped to just under 94%. It remains to be seen if this general downturn in the market is a short term blip or an emerging trend. Recent reports that the CBI are revising their growth forecast for 2015 and the Bank of England proclaiming that interest rates won’t rise until Spring 2016 suggests that retail demand for used LCVs is likely to remain healthy for the foreseeable future.
As we have mentioned many times before though, the used wholesale market is in danger of becoming a victim of its own success. Whichever theory you subscribe to regarding why, generally, the fact is that the average market price of used LCVs are disproportionately high compared to the discounted prices that you can buy brand new vehicles for. Naturally there is an expectation that later plates will be worth progressively more but the problem is that 3-4 year stock market prices are so high that when you extrapolate the values forwards for the later plates, the guide values are too close to the discounted prices being offered by franchised dealers. This problem is exacerbated for the used LCV dealer because new vehicle finance rates are far more attractive to those available for used vehicles making it harder for them to compete against the franchised dealer whilst still retaining a reasonable profit.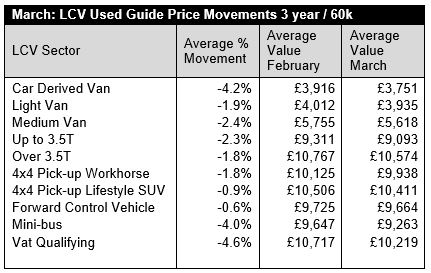
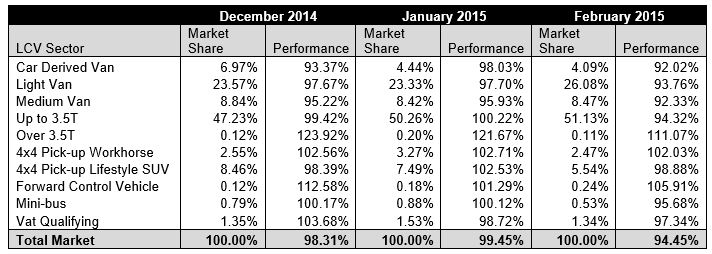
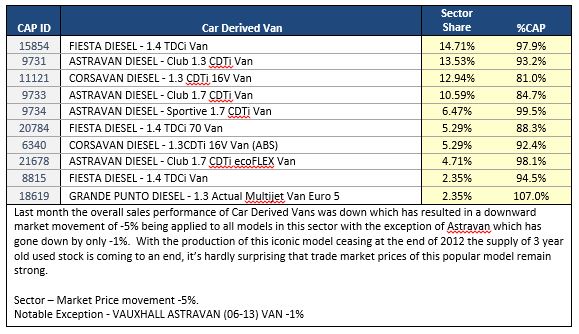
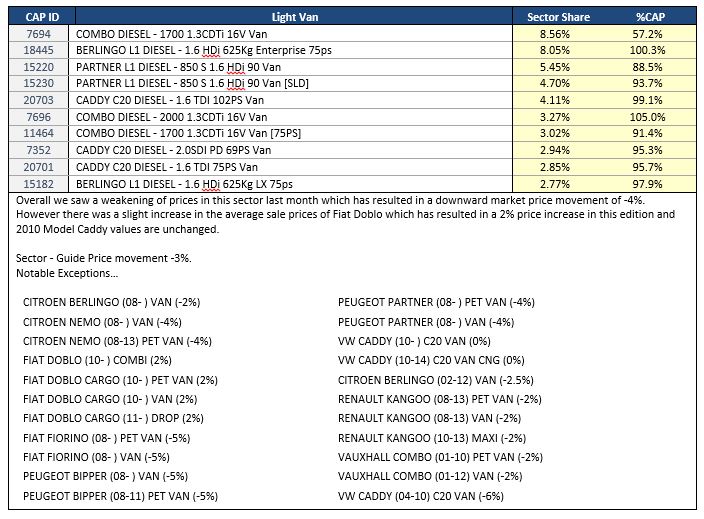
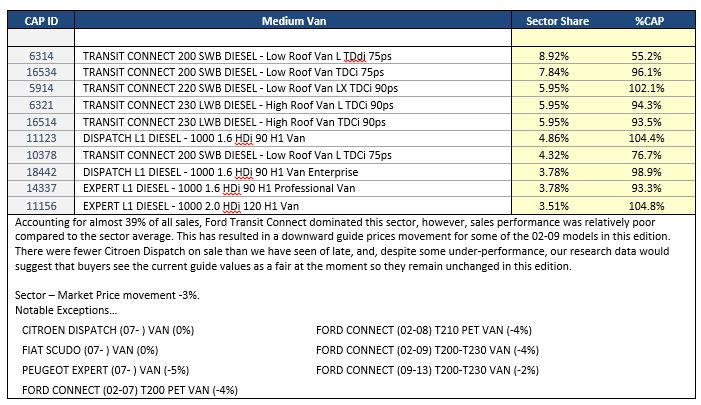
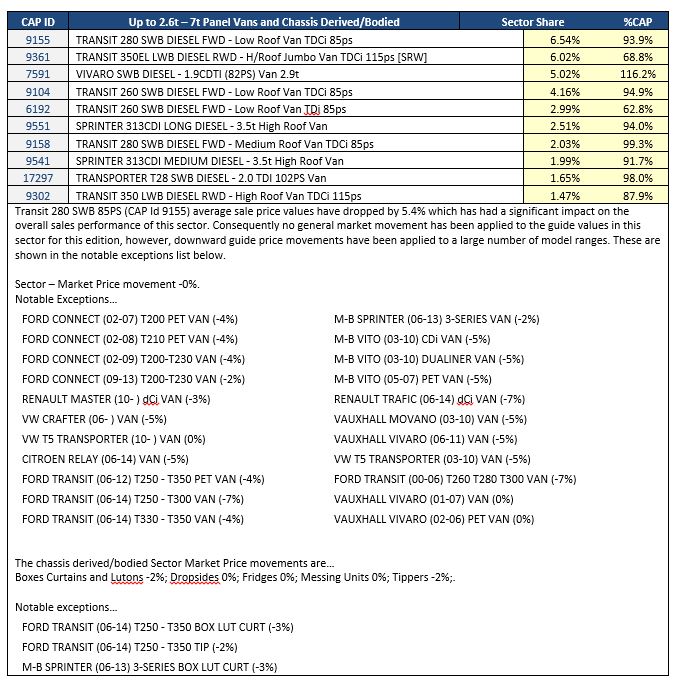
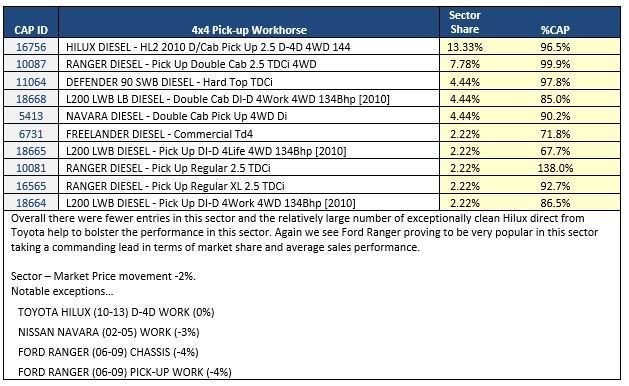
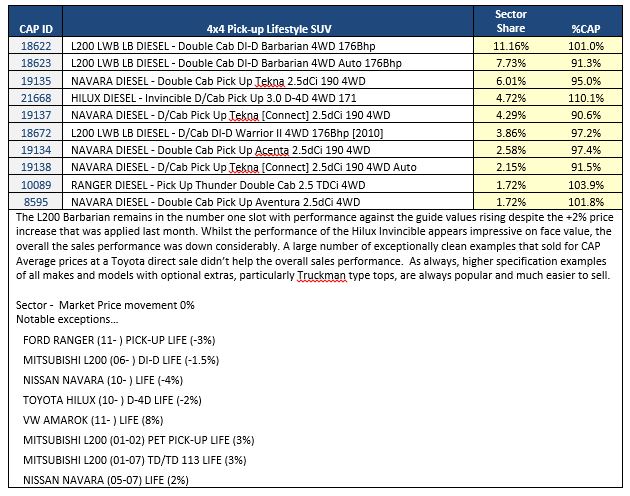
The Top 10 Models in each sector tables below are intended to give you a clearer picture of the models that are driving the prices in the used LCV Market. It should be noted that that the Sector Share is based on actual sales and not the availability of these models in the marketplace. The %CAP performance values are also based on actual sales.
Since our guide values reflect the market prices of basic vans in plain white as they appear in the vehicle manufacturer’s price lists, some of guide price movements you might see in this edition may not correlate directly with the sales performances shown in the tables which include vehicles in all colours and specifications.
In some of these tables you may also notice the same model description appearing more than once, however, the CAP Identity numbers will always be unique. Generally the lower CAP Identity numbers signify older models and higher ones are newer models; further details can be found by looking up the model/CAP Id number in the prices section of the guide.
Ken Brown- Red Book Editor LCV's