LCV Editorial February 2015


LCV Marketplace
As expected the New Year got off to a flying start with higher attendance levels than we’ve seen for some time and improved supply of stock in noticeably better condition. Without exception, at all of the sales we attended across the UK the atmosphere was charged with an air of expectation as both trade and end users battled to secure the most desirable lots. It remains to be seen if the furore of trade activity we witnessed is sustainable over the coming weeks or simply a result of last year’s pent up demand. The same can be also be said of the improved supply which was clearly a major contributory factor. Time will tell if this too is sustainable in the longer term, or if it was simply a backlog down to the fact that there were fewer auction sales during December and that many vehicle remarketing staff, like the rest of us, took extended holiday breaks.
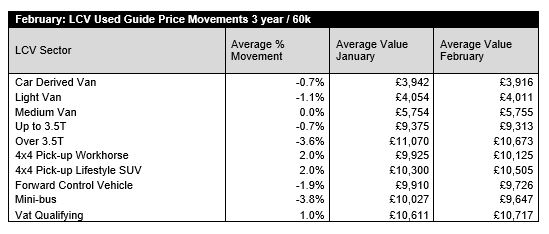
A common question we are asked when very large fleet operators replace their existing vehicles is what effect it might have on market prices and what action we are likely to take regarding the guide values. The short answer is nothing! What I mean by that is, the guide prices move when the market prices actually change; we never pre-empt change in Red Book – we observe it happening then endeavour to reflect it in the guide prices.
This is particularly relevant at this time considering the widely reported news that City Link has gone into administration and its fleet of 2500 vehicles is no longer operating. Naturally there is concern that the used LCV wholesale market will become over-supplied with large panel vans. With nobody seemingly aware, or prepared to disclose for understandable reasons, the exact LCV content of the fleet, model mix and age/mileage profiles this only adds to the speculation.
It worth reminding subscribers that CAP’s current used LCV values are benchmarked against plain white vehicles in basic spec as they appear in the vehicle manufacturer’s price list. Since City Link vehicles are clearly identifiable in their distinctive yellow and green livery, whatever prices they sell for at auction will not directly affect the guide prices of equivalent models in white. Of course, depending on how the market reacts there could be a knock on effect for the sector as a whole and this is something we will be closely monitoring over the coming weeks.
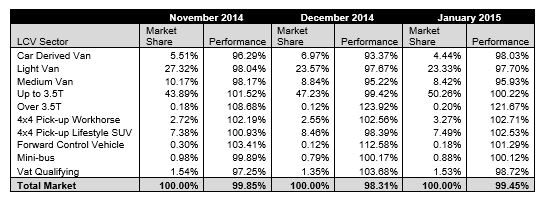
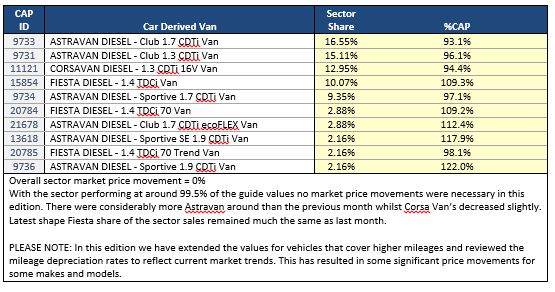
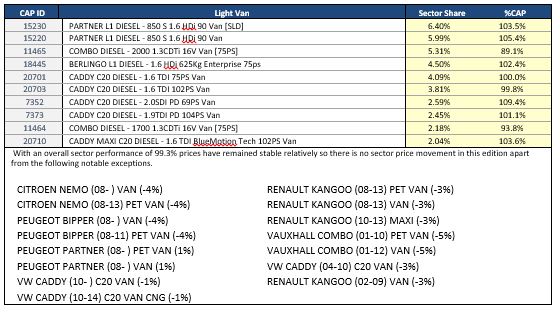
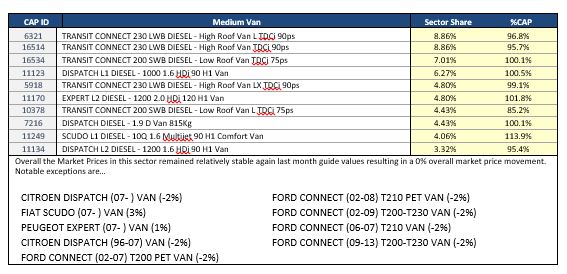
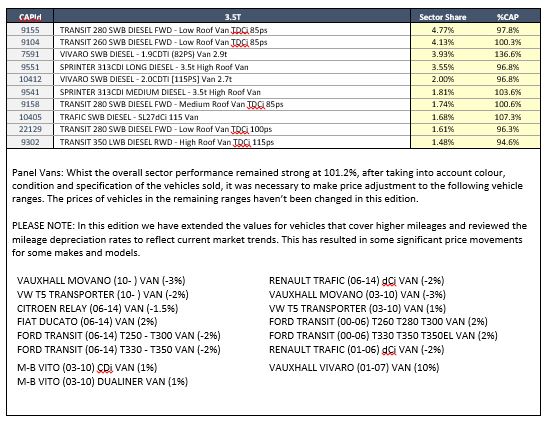
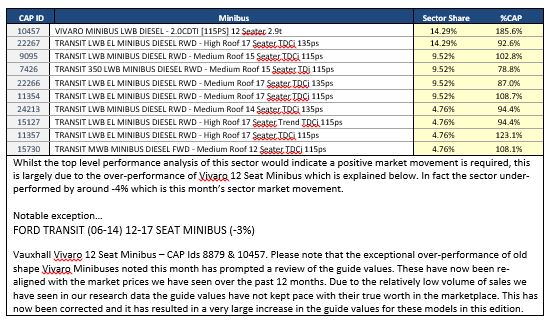
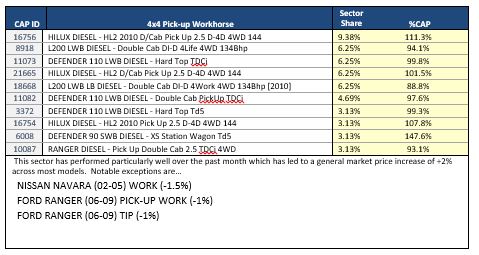
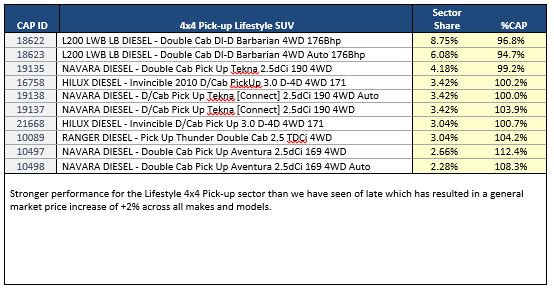
The Top 10 Models in each sector tables below are intended to give you a clearer picture of the models that are driving the prices in the used LCV Market. It should be noted that that the Sector Share is based on actual sales and not the availability of these models in the marketplace. The %CAP performance values are also based on actual sales.
Since our guide values reflect the market prices of basic vans in plain white as they appear in the vehicle manufacturer’s price lists, some of guide price movements you might see in this edition may not correlate directly with the sales performances shown in the tables which include vehicles in all colours and specifications.
In some of these tables you may also notice the same model description appearing more than once, however, the CAP Identity numbers will always be unique. Generally the lower CAP Identity numbers signify older models and higher ones are newer models; further details can be found by looking up the model/CAP Id number in the prices section of the guide.