LCV Editorial August 2014


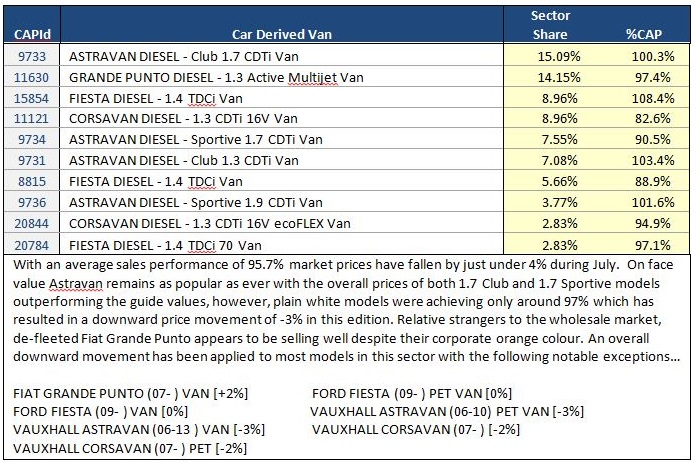
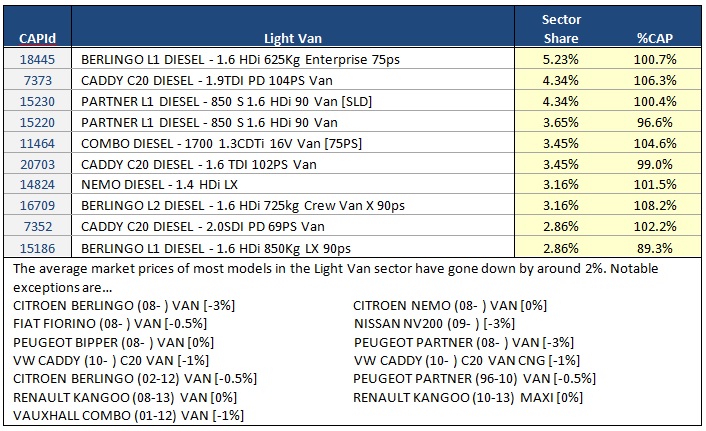
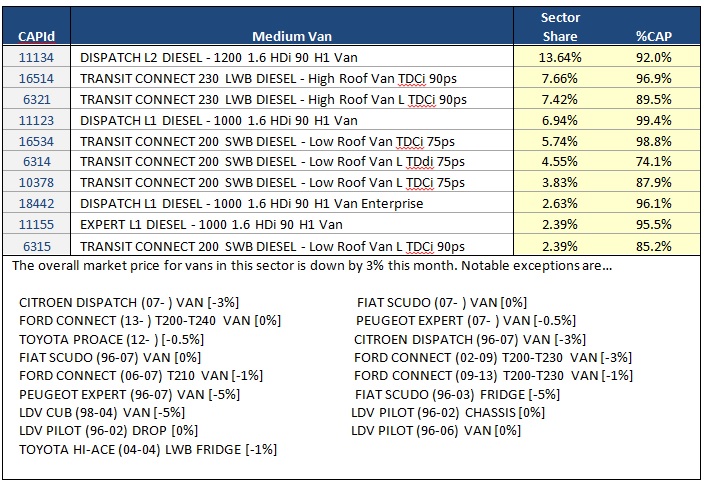
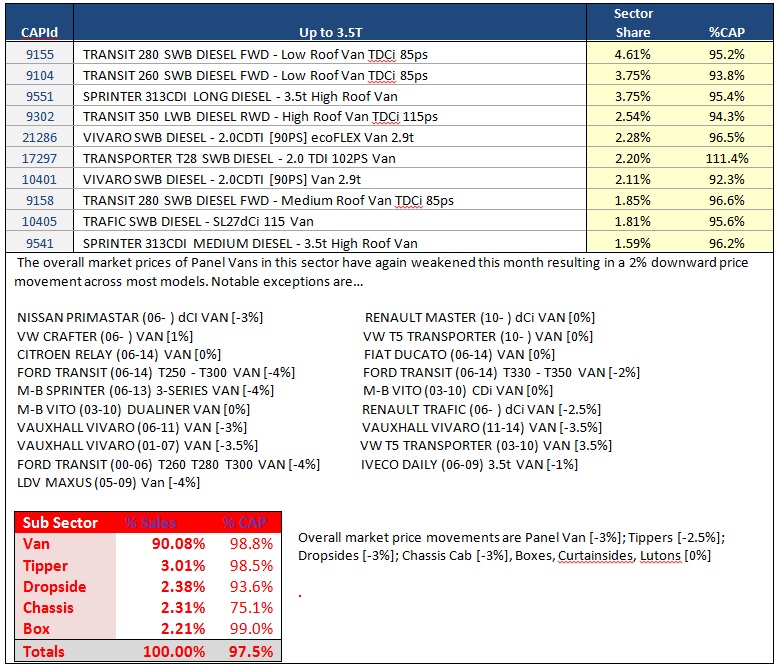
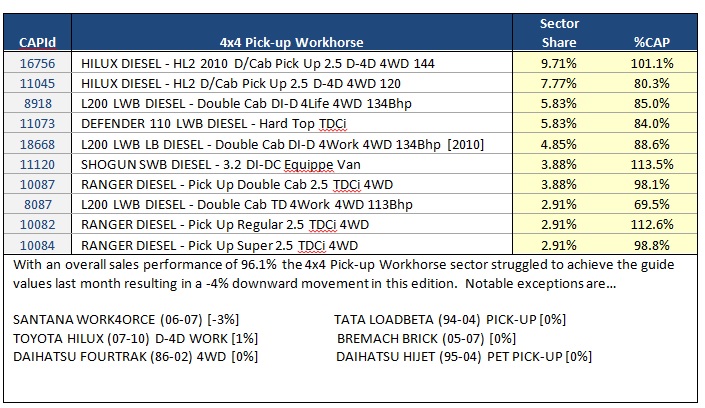
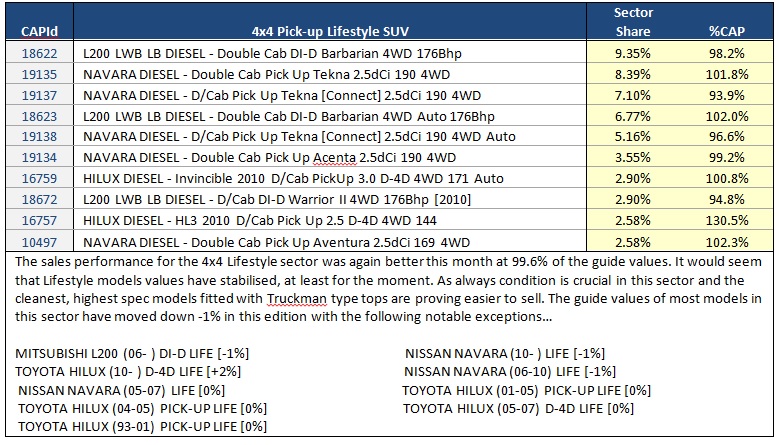
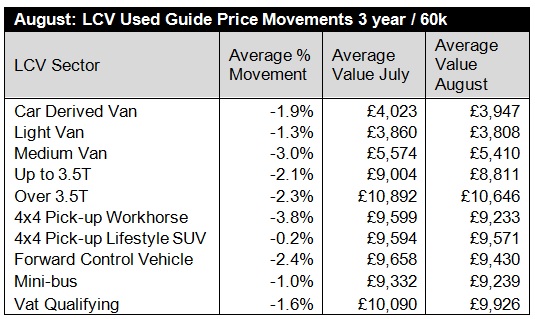
During the early part of the month the auctions we attended appeared busy enough with most lots selling on the day, however, with the summer holiday season rapidly approaching, by the middle of the month things started to change and the expected seasonal downturn in demand began to take effect. Consequently, on average used LCV wholesale market prices are down by around 2.18% in this edition but, as always there some considerable variations across the sectors. At -4% the ‘Workhorse’ 4x4 pick-ups are worse affected whilst 4x4 Lifestyle pick-ups and Minibuses are down by only 1%. Car-Derived Vans, Medium Vans & Large Panel Vans are down by 3% whilst Light Vans fared slightly better and have only gone down by 2%.
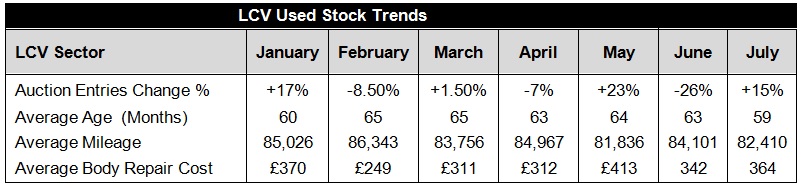
From a supply perspective there was a marked improvement with auction entries increasing by 15% compared to last month. The average age has decreased slightly from 63 months to 59 months and the average recorded mileage has decreased from 84,101 to 82,410. However, from our own independent vehicle inspections the average repair cost for body panel damage on vehicles presented for sale increased from £342 to £364 over the month.
We normally expect to see a steady increase in market prices after the Easter holidays up until around the middle of July, then a downward trend across all sectors continuing throughout August into early September. This year it would appear there’s been a shift in this traditional buying pattern for used LCVs because prices have been falling across most sectors since they peaked just prior to Easter. Arguably this stems from the exceptionally high market prices we saw towards the end of last year which was brought about by limited supply and the release of pent up demand which we suggested at the time was linked to better than expected growth in the service sector of the economy. By the April though it became clear that these prices were unsustainable particularly as the published late plate values of some models were disproportionately high compared to the equivalent new vehicle transaction prices. With the holiday season reaching its peak during August it’s perhaps inevitable that auction buying activity will continue to slowdown and it is likely this will be reflected by a further weakening of prices.
Looking forward though, with the summer holidays a distant memory, there is nothing to suggest that prices won’t recover early in September as trading activity resumes.
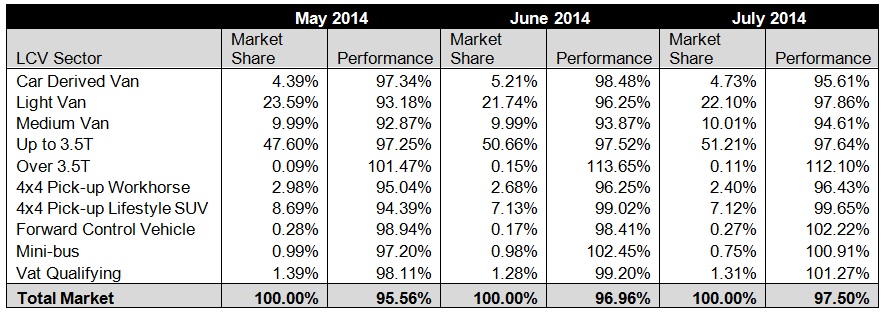
The top 10 models in the sector tables below are intended to give you a clearer view of what’s driving the market. It should be noted that that the Sector Share is based on actual sales and not the availability of these models in the marketplace. The %CAP performance values are also based on actual sales.
Since our guide values reflect the market prices of basic vans in plain white as they appear in the vehicle manufacturer’s price lists, some of guide price movements you might see in this edition may not correlate directly with the sales performances shown in the tables which include vehicles in all colours and specifications.
In some of these tables you may also notice the same model description appearing more than once, however, the CAP Identity numbers will always be unique. Generally the lower CAP Identity numbers signify older models and higher ones are newer models; further details can be found by looking up the model/CAP Id number in the prices section of the guide.