LCV Editorial July 2014


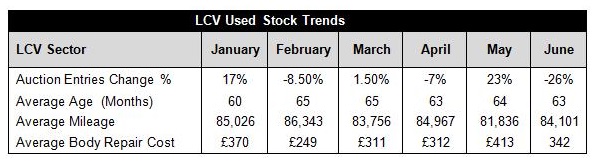
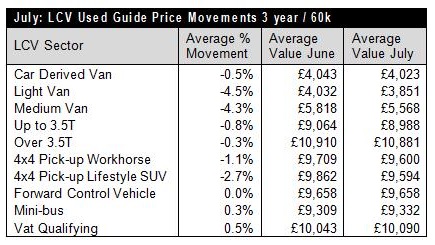
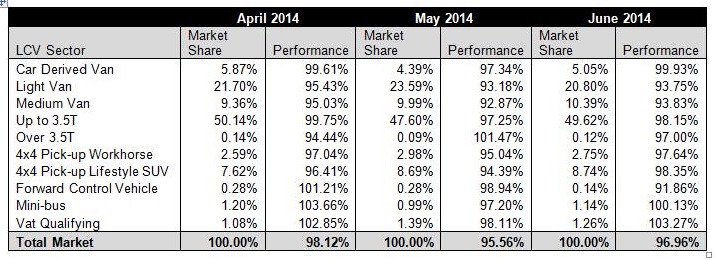
Contradictory research evidence gathered throughout June suggests that the used LCV wholesale market is in a state of flux. Up until around the middle of the month auction attendances hadn’t really increased much beyond the levels we were seeing just after the Easter holidays. Bidding activity was painfully slow at times with auctioneers often struggling to gain starting bids. With many lots failing to achieve their reserve prices or selling provisionally, we fully expected the number of recorded sales to be significantly lower than last month but in fact they were up by almost 31%. As always the ever-present Internet buyers accounted for many of these sales but it’s also clear that a significant number of provisional bids were being converted into sales which is normally a sure sign that market prices are moving downwards. However, towards the end of the month, we started to see a distinct increase in both the number of auction entries and attendance levels amidst early reports that demand in the retail market was increasing. Generally prices have remained relatively stable with only Light Van, Medium Van and 4x4 Lifestyle Pick-Ups sectors showing any significant signs of weakness against June guide values. From a supply perspective, compared to May, auction entries were down by 26%. However, much of this can be attributed to the early part of the month as we saw larger sale entries during the last two weeks of June. The average age of vehicles decreased slightly from 64 months to 63 months whilst the average recorded mileage increased from 81,836 to 84,101 and, from our own independent vehicle inspections, the average repair cost for body panel damage on vehicles presented for sale decreased from £413 to £342 over the month. Since the anticipated fall in market prices during April, this year we have not really seen any significant growth in demand and the accompanied steady rise in market prices which usually continues until the end of July. With plenty of stock around at the moment it remains to be seen if the market rallies over the next few weeks before the inevitable downturn as the summer holiday season begins.
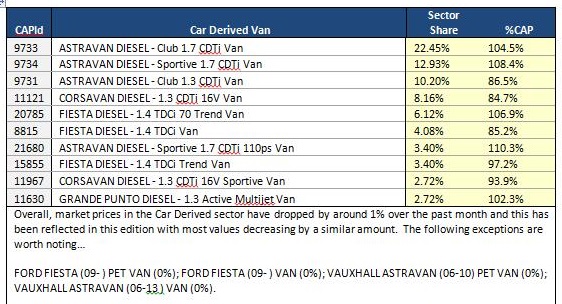
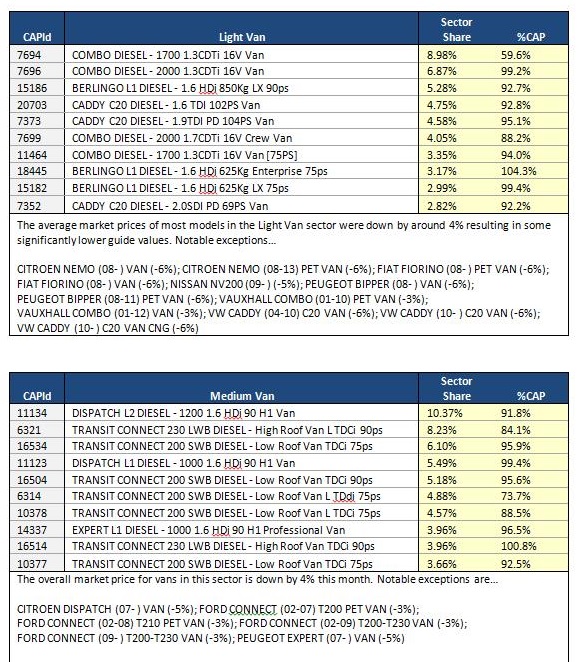
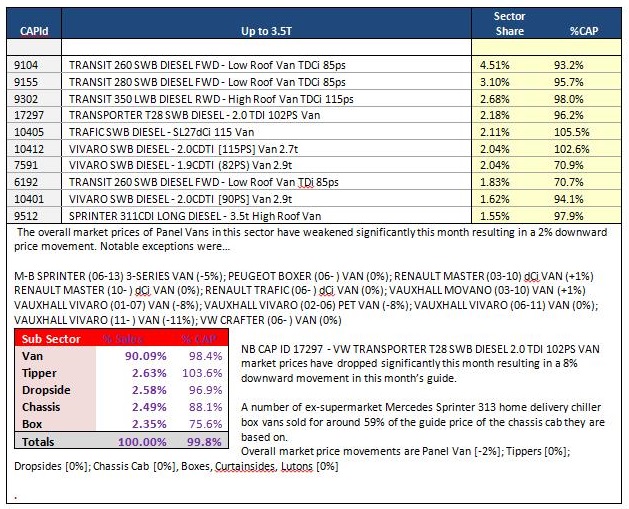
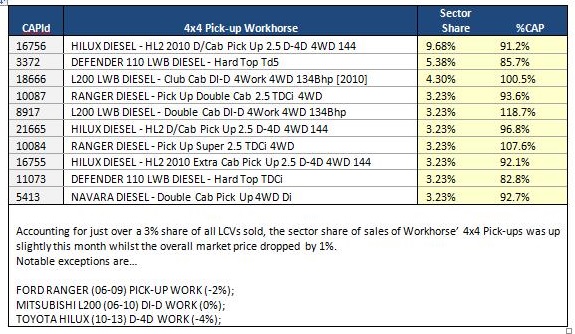
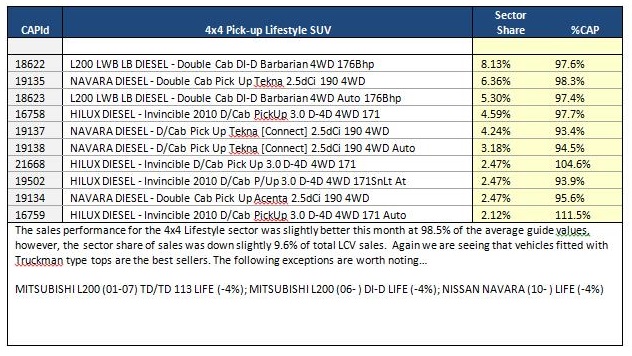
The top 10 models in the sector tables below are intended to give you a clearer view of what’s driving the market. It should be noted that that the Sector Share is based on actual sales and not the availability of these models in the marketplace. The %CAP performance values are also based on actual sales.
Since our guide values reflect the market prices of basic vans in plain white as they appear in the vehicle manufacturer’s price lists, some of guide price movements you might see in this edition may not correlate directly with the sales performances shown in the tables which include vehicles in all colours and specifications.
In some of these tables you may also notice the same model description appearing more than once, however, the CAP Identity numbers will always be unique. Generally the lower CAP Identity numbers signify older models and higher ones are newer models; further details can be found by looking up the model/CAP Id number in the prices section of the guide.