LCV Editorial May 2014


LCV MARKETPLACE
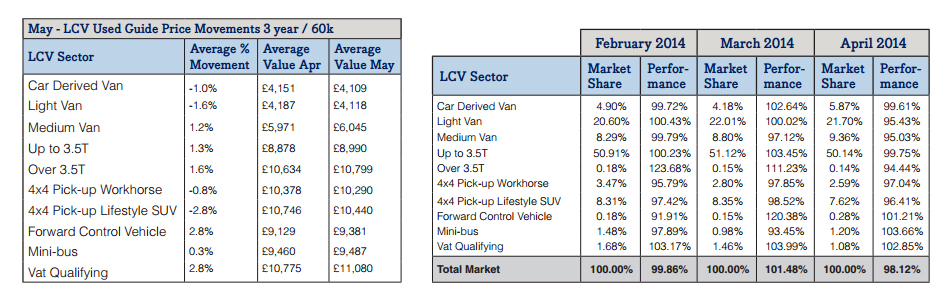
With the Easter Holiday break looming the expected lull in demand became evident by the end of the second week of April. Whilst auction attendance levels remained healthy at the sales we attended, there appeared to be fewer professional buyers around with many of the familiar faces we’d expect to see missing. Buying activity was noticeably slower at times, and, for the first time since the beginning of the year, prices weakened slightly with the overall LCV sector down by just over 1%. Although in the course of conducting research over the past few weeks we’ve heard reports that retail demand for used LCVs is slowing down, up until this month we’ve seen no hard evidence to support this. However, in a month when the leader of the IMF admits to under-forecasting UK economic growth and predicts it will grow faster than all other advanced economies this year, we see this no more than a seasonal blip. According to the Chartered Institute of Purchasing Managers, there is no end in sight to the sustained growth in the Services Sector which is by far the biggest user of LCVs, so we fully expect prices to recover during May. As reported last month though, the used market prices of some of the highest volume models are at an all-time high. Consequently, many of the published used values of some models in this guide are now disproportionately high when compared to the equivalent new vehicle transaction price. We are constantly modifying the age depreciation rates of some models to ensure that the current plate values do not exceed the vehicle manufacturer’s list prices. Since the aim of Red Book is to reflect the average prices that buyers actually pay we have no other option to publish these values accordingly.
From a supply perspective, compared to last month, auction entries were down by 7%. The average age of vehicles decreased from 65 months to 63 months, whilst average mileage increased slightly to 84,967. From our own independent vehicle inspections, on average the overall quality of auction entries has remained the same with the average repair cost for body panel damage on vehicles presented for sale decreasing by only £1 compared with last month.
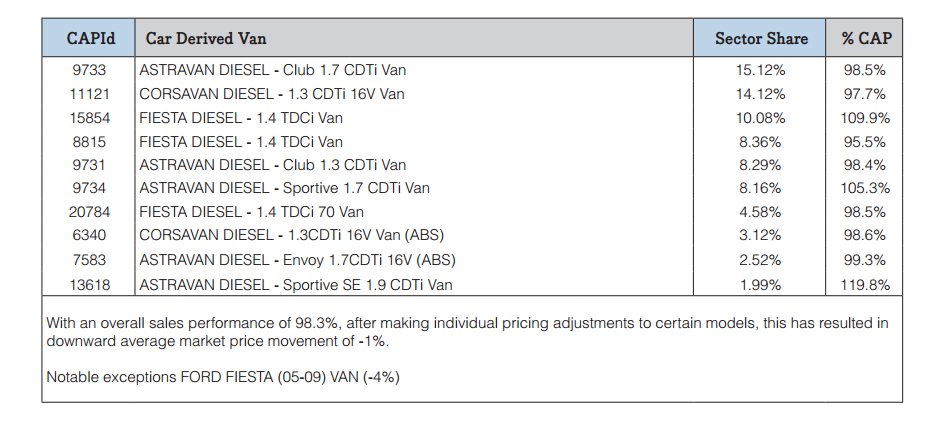
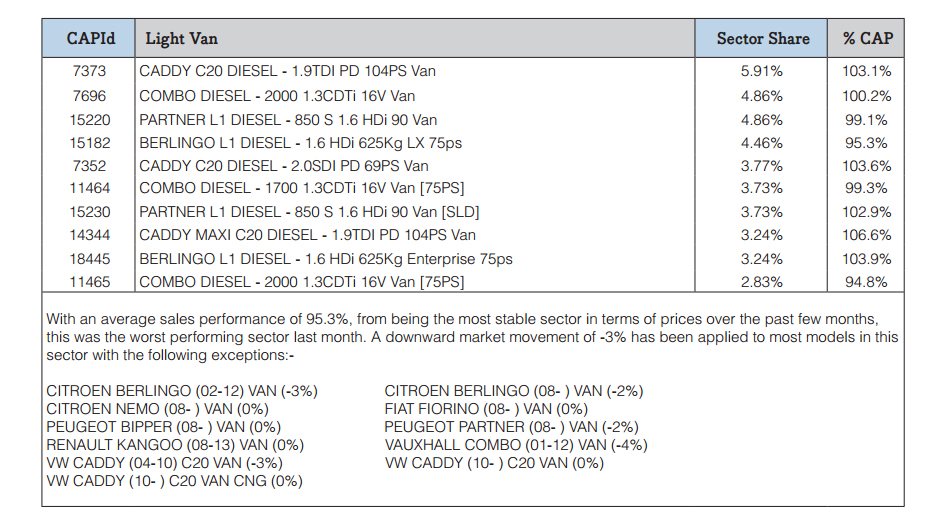
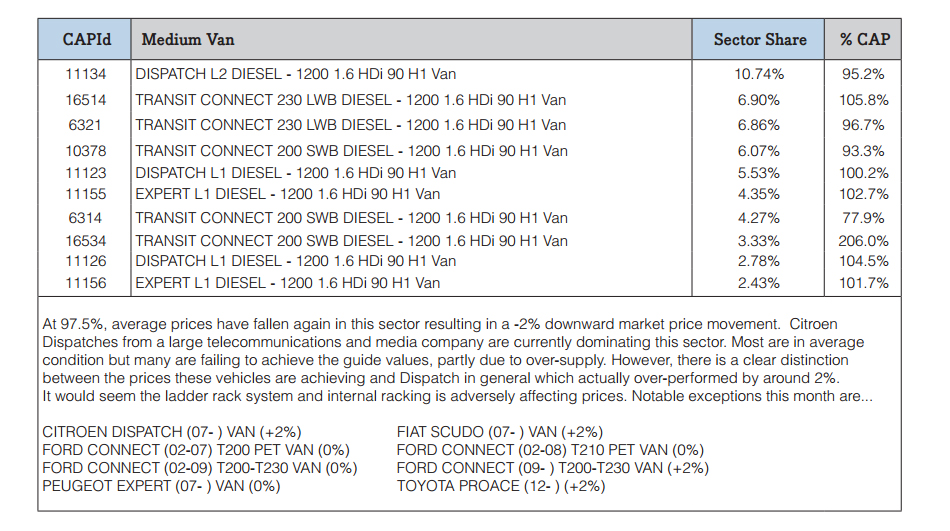
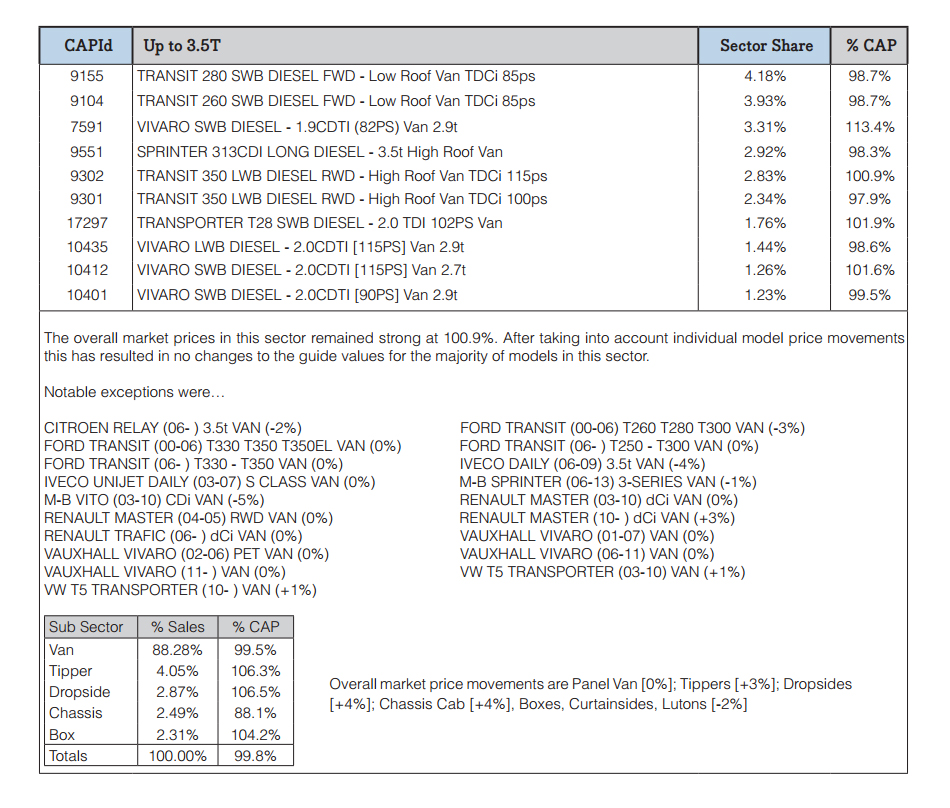
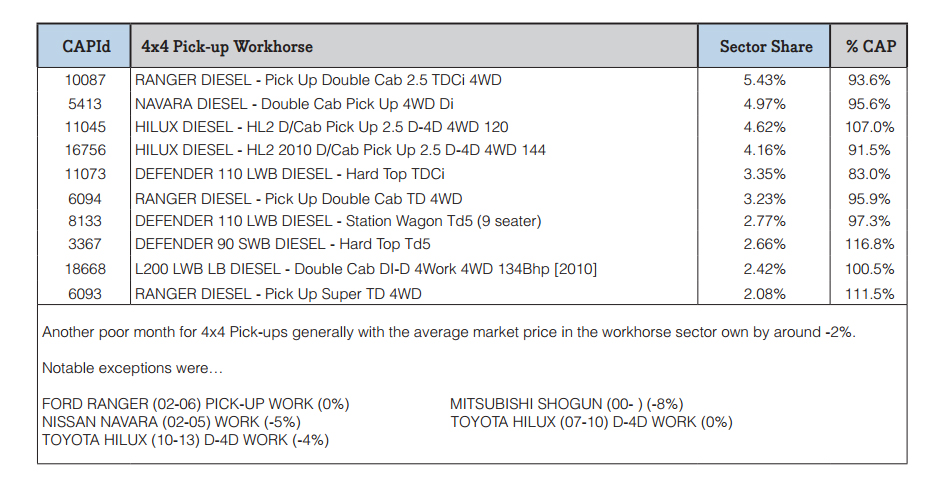
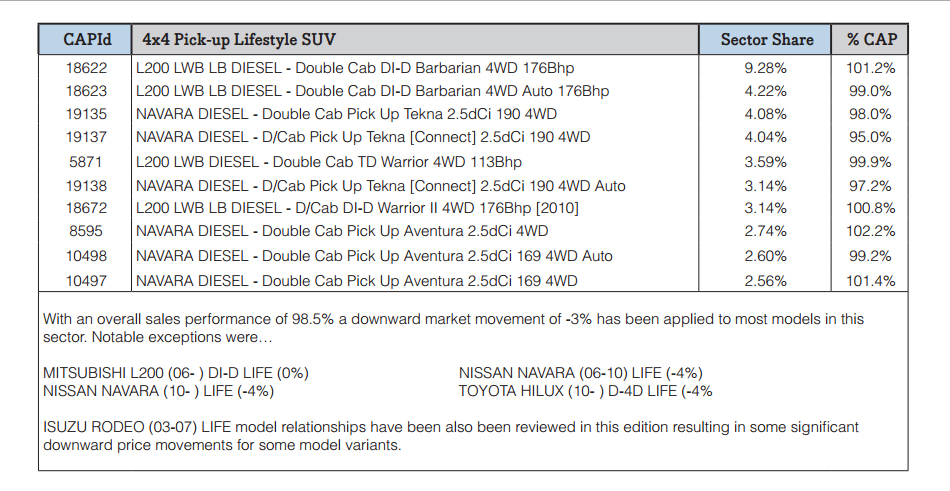
The top 10 models in the sector tables below are intended to give you a clearer view of what’s driving the market. It should be noted that that the Sector Share is based on actual sales and not the availability of these models in the marketplace. The %CAP performance values are also based on actual sales.
Since our guide values reflect the market prices of basic vans in plain white as they appear in the vehicle manufacturer’s price lists, some of guide price movements you might see in this edition may not correlate directly with the sales performances shown in the tables which include vehicles in all colours and specifications.
In some of these tables you may also notice the same model description appearing more than once, however, the CAP Identity numbers will always be unique. Generally the lower CAP Identity numbers signify older models and higher ones are newer models; further details can be found by looking up the model/CAP Id number in the prices section of the guide.